Appendix B: Advanced Serial Command Reference
This reference covers the protocol-level command families visible in the Serial Monitor. Useful for understanding the sketch-to-app communication or debugging protocol issues or writing libraries to support additional platforms.
| Command Family | What It Controls |
|---|---|
[viewpoint] |
handshake and protocol setup — resets serial configuration and traces |
[cartesian], [scatter], [polar] |
plot type and number of plots |
[continuous], [frames] |
update mode |
[packet size] |
frame or packet sizing |
[axis] |
ranges, steps, and divisions |
[units] |
units text |
[plot labels] and [sketch] |
plot and sketch titles |
[trace labels] and [trace color] |
trace naming and color |
[trace filter] |
derived or filtered traces |
[display mode] |
spectrogram, persistence, gradient, or none |
[grid colors] and [reference line] |
visual overlays and grid styling |
[time] |
timestamps |
[message] and [error] |
app messages and warnings |
This appendix describes the human-readable V1 command protocol for sending configuration commands to VoidLoop ViewPoint™ over serial. It is intended for users who want to write their own microcontroller or host-side library. For the desktop-app-side (sketch) equivalents of these commands, see the API Reference.
Command Format
Commands are one line of text ending with a newline:
The command token, including brackets, is case-sensitive and must match exactly. Argument names are case-insensitive because VoidLoop ViewPoint™ lowercases keys before lookup.
Argument values are not escaped
Avoid commas and equals signs inside text values — the parser does not escape them.
Only [ lines are V1 commands
Only lines that start with [ are treated as V1 commands. Data lines
are separate CSV-style numeric rows.
Session Lifecycle
A normal configuration sequence is:
[viewpoint]version=V1R1
[cartesian]plots=1
[continuous]
[packet size]size=500
[trace labels]labels=Trace 1
[viewpoint]completed=true
[viewpoint]version=V1R1 starts a new configuration session and resets
the app-side serial plot configuration. Send plot setup commands after
it. [viewpoint]completed=true ends the configuration block and tells
VoidLoop ViewPoint™ it can use the configuration.
Frames mode
In frames mode, send [frames]complete=true after each complete frame
of data so VoidLoop ViewPoint™ knows when to commit and render that frame.
Common Values
| Value type | Accepted values |
|---|---|
| Plot index | 0, 1, 2, etc. Use -1 or omit plot where supported to target all plots. |
| Axis | x, y, r, t. r maps to the radial axis and t maps to theta for polar plots. |
| Boolean | true or false in lowercase. |
| Color | Hex RGB or ARGB: F00, FF0000, 80FF0000, #00FF00, or 0x00FF00. Six-digit RGB is treated as opaque. |
| Display mode | none, spectrogram, persistence, gradient. |
| Trace filter | none, average, maxhold. |
| Reference line style | solid, dashed, dotted, pattern. |
| Axis scaling strategy | none, expand_only, windowed, robust_percentile, peak_decay, debounced, symmetric_zero, baseline_zero. |
Commands
[viewpoint]
Starts or completes a configuration block.
| Argument | Required | Description |
|---|---|---|
version |
Start only | Protocol version. Use V1R1. |
completed |
Complete only | Use true to mark the configuration block complete. |
Examples:
[sketch]
Sets the sketch/session title.
| Argument | Required | Description |
|---|---|---|
title |
Yes | Title text. |
Example:
[cartesian]
Selects Cartesian plotting and sets the number of plots.
| Argument | Required | Description |
|---|---|---|
plots |
No | Number of plots. Defaults to 1. |
Example:
[scatter]
Selects scatter plotting and sets the number of plots.
| Argument | Required | Description |
|---|---|---|
plots |
No | Number of plots. Defaults to 1. |
Example:
[polar]
Selects polar plotting and configures the angular axis. Polar mode uses one plot.
| Argument | Required | Description |
|---|---|---|
degrees |
No | true for degrees, false for radians. Defaults to true. |
offset |
No | Angular offset. Defaults to 0. |
step |
No | Angular segment size. Defaults to 15. |
Example:
[continuous]
Sets continuous scrolling mode. No arguments.
Example:
[frames]
Sets frames mode, or marks one frame complete.
| Argument | Required | Description |
|---|---|---|
complete |
No | Send true after a full frame of data. Omit this argument when selecting frames mode. |
Examples:
[packet size]
Sets the display window size in samples.
| Argument | Required | Description |
|---|---|---|
size |
Yes | Number of samples retained in the visible packet/window. |
Example:
[trace labels]
Sets primary trace labels in channel order.
| Argument | Required | Description |
|---|---|---|
labels |
Yes | Comma-separated labels. The parser treats the whole value after labels= as the label list. |
Example:
[trace color]
Sets one trace color.
| Argument | Required | Description |
|---|---|---|
trace |
Yes | Primary trace index. |
color |
Yes | Hex color. |
Example:
Send one [trace color] command per trace. The bulk form colors=...
is not supported by the V1 app parser.
[trace filter]
Creates or removes an app-side derived trace for a primary source trace. Derived traces are currently useful for Cartesian frames-mode workflows.
| Argument | Required | Description |
|---|---|---|
trace |
Yes | Source primary trace index. |
type |
Yes | average, maxhold, minhold, or none. |
param |
No | Filter parameter. Defaults to 0.3 for average, otherwise 0.95. |
color |
No | Hex color for the derived trace. |
label |
No | Label for the derived trace. |
Examples:
[trace filter]trace=0,type=average,param=0.25,color=00AAFF,label=Average
[trace filter]trace=0,type=none
type=none removes derived traces for the specified source trace.
[add traces]
Associates existing traces with a plot.
| Argument | Required | Description |
|---|---|---|
plot |
No | Plot index. Defaults to 0. |
traces |
Yes | Comma-separated trace indices. |
Example:
[plot labels]
Sets a plot title and axis labels.
| Argument | Required | Description |
|---|---|---|
plot |
No | Plot index, or omit/use -1 for all plots. |
title |
No | Plot title. |
x |
No | X-axis label. |
y |
No | Y-axis label. |
Example:
[units]
Sets axis units.
| Argument | Required | Description |
|---|---|---|
plot |
No | Plot index, or omit/use -1 for all plots. |
x |
No | X-axis unit. |
y |
No | Y-axis unit. |
Example:
[axis]
Configures an axis range and tick behavior.
| Argument | Required | Description |
|---|---|---|
plot |
No | Plot index, or omit/use -1 for all plots. |
axis |
No | x, y, r, or t. Unknown or omitted axes are ignored by most app behavior. |
min |
No | Axis minimum. |
max |
No | Axis maximum. |
auto |
No | true or false. If min or max is sent and auto is omitted, VoidLoop ViewPoint™ treats auto-scaling as disabled for that axis. |
strategy |
No | Axis scaling strategy. |
divisions |
No | Number of tick divisions. Positive values select division-based ticks. |
minor |
No | Minor tick step. Positive minor or major selects step-based ticks. |
major |
No | Major tick step. |
Examples:
[axis]plot=0,axis=y,min=-1,max=1,minor=0.1,major=0.5
[axis]plot=0,axis=y,auto=true,strategy=windowed
If min and max are both present and inverted, VoidLoop ViewPoint™ swaps them.
If they are equal or non-finite, the command is ignored. divisions
values above 1000 are clamped.
[log scale]
Enables or disables logarithmic scaling for an axis. Log scaling is supported on Cartesian Y, scatter X/Y, and polar radial axes. Unsupported combinations are ignored.
| Argument | Required | Description |
|---|---|---|
plot |
No | Plot index, or omit/use -1 for all plots. |
axis |
Yes | Axis to scale. |
enabled |
No | true or false. Omitted means enabled. |
mapdata |
No | true when incoming data is linear and VoidLoop ViewPoint™ should map it to log space. false when incoming data is already log-scaled. |
Examples:
[log scale]plot=0,axis=y
[log scale]plot=0,axis=y,enabled=false
[log scale]plot=0,axis=y,mapdata=false
[reference line]
Adds or updates a custom reference line.
| Argument | Required | Description |
|---|---|---|
plot |
No | Plot index, or omit/use -1 for all plots. |
axis |
Yes | Axis for the reference line. |
value |
Yes | Axis value where the line is drawn. |
color |
No | Hex color. |
stroke |
No | Line stroke width. Defaults to 1. |
id |
No | Stable sender-side ID. Reusing the same ID updates that line instead of adding another one. |
style |
No | solid, dashed, dotted, or pattern. |
ismajor |
No | Marks the line as major. |
Example:
[grid colors]
Sets plot grid and label colors.
| Argument | Required | Description |
|---|---|---|
plot |
No | Plot index, or omit/use -1 for all plots. |
labels |
No | Axis label/tick text color. |
major |
No | Major gridline color. |
minor |
No | Minor gridline color. |
stroke |
No | Axis stroke width. |
Example:
[display mode]
Sets a plot display mode.
| Argument | Required | Description |
|---|---|---|
plot |
No | Plot index, or omit/use -1 for all plots. |
mode |
Yes | none, spectrogram, persistence, or gradient. |
trace |
No | Trace index used by the display mode. Defaults to 0; -1 means all traces. |
colors |
No | Comma-separated hex colors for spectrogram color maps. |
Examples:
[display mode]plot=0,mode=persistence,trace=0
[display mode]plot=0,mode=spectrogram,trace=0,colors=000000,00AAFF,FFFFFF
[display mode]plot=0,mode=none
See the Display Modes recipe for a worked example of driving these modes from a frame stream.
[time]
Provides a source timestamp for subsequent data rows, primarily for CSV capture alignment.
| Argument | Required | Description |
|---|---|---|
raw |
Yes | Numeric timestamp. Values below 1000000000000000 are interpreted as microseconds; larger values are interpreted as nanoseconds. |
Example:
[message] and [error]
Accepted by the parser for sender-side status messages. In the current app command pipeline, they do not change plot configuration.
| Command | Arguments |
|---|---|
[message] |
title optional, message optional |
[error] |
title optional, message optional |
Examples:
Complete Example
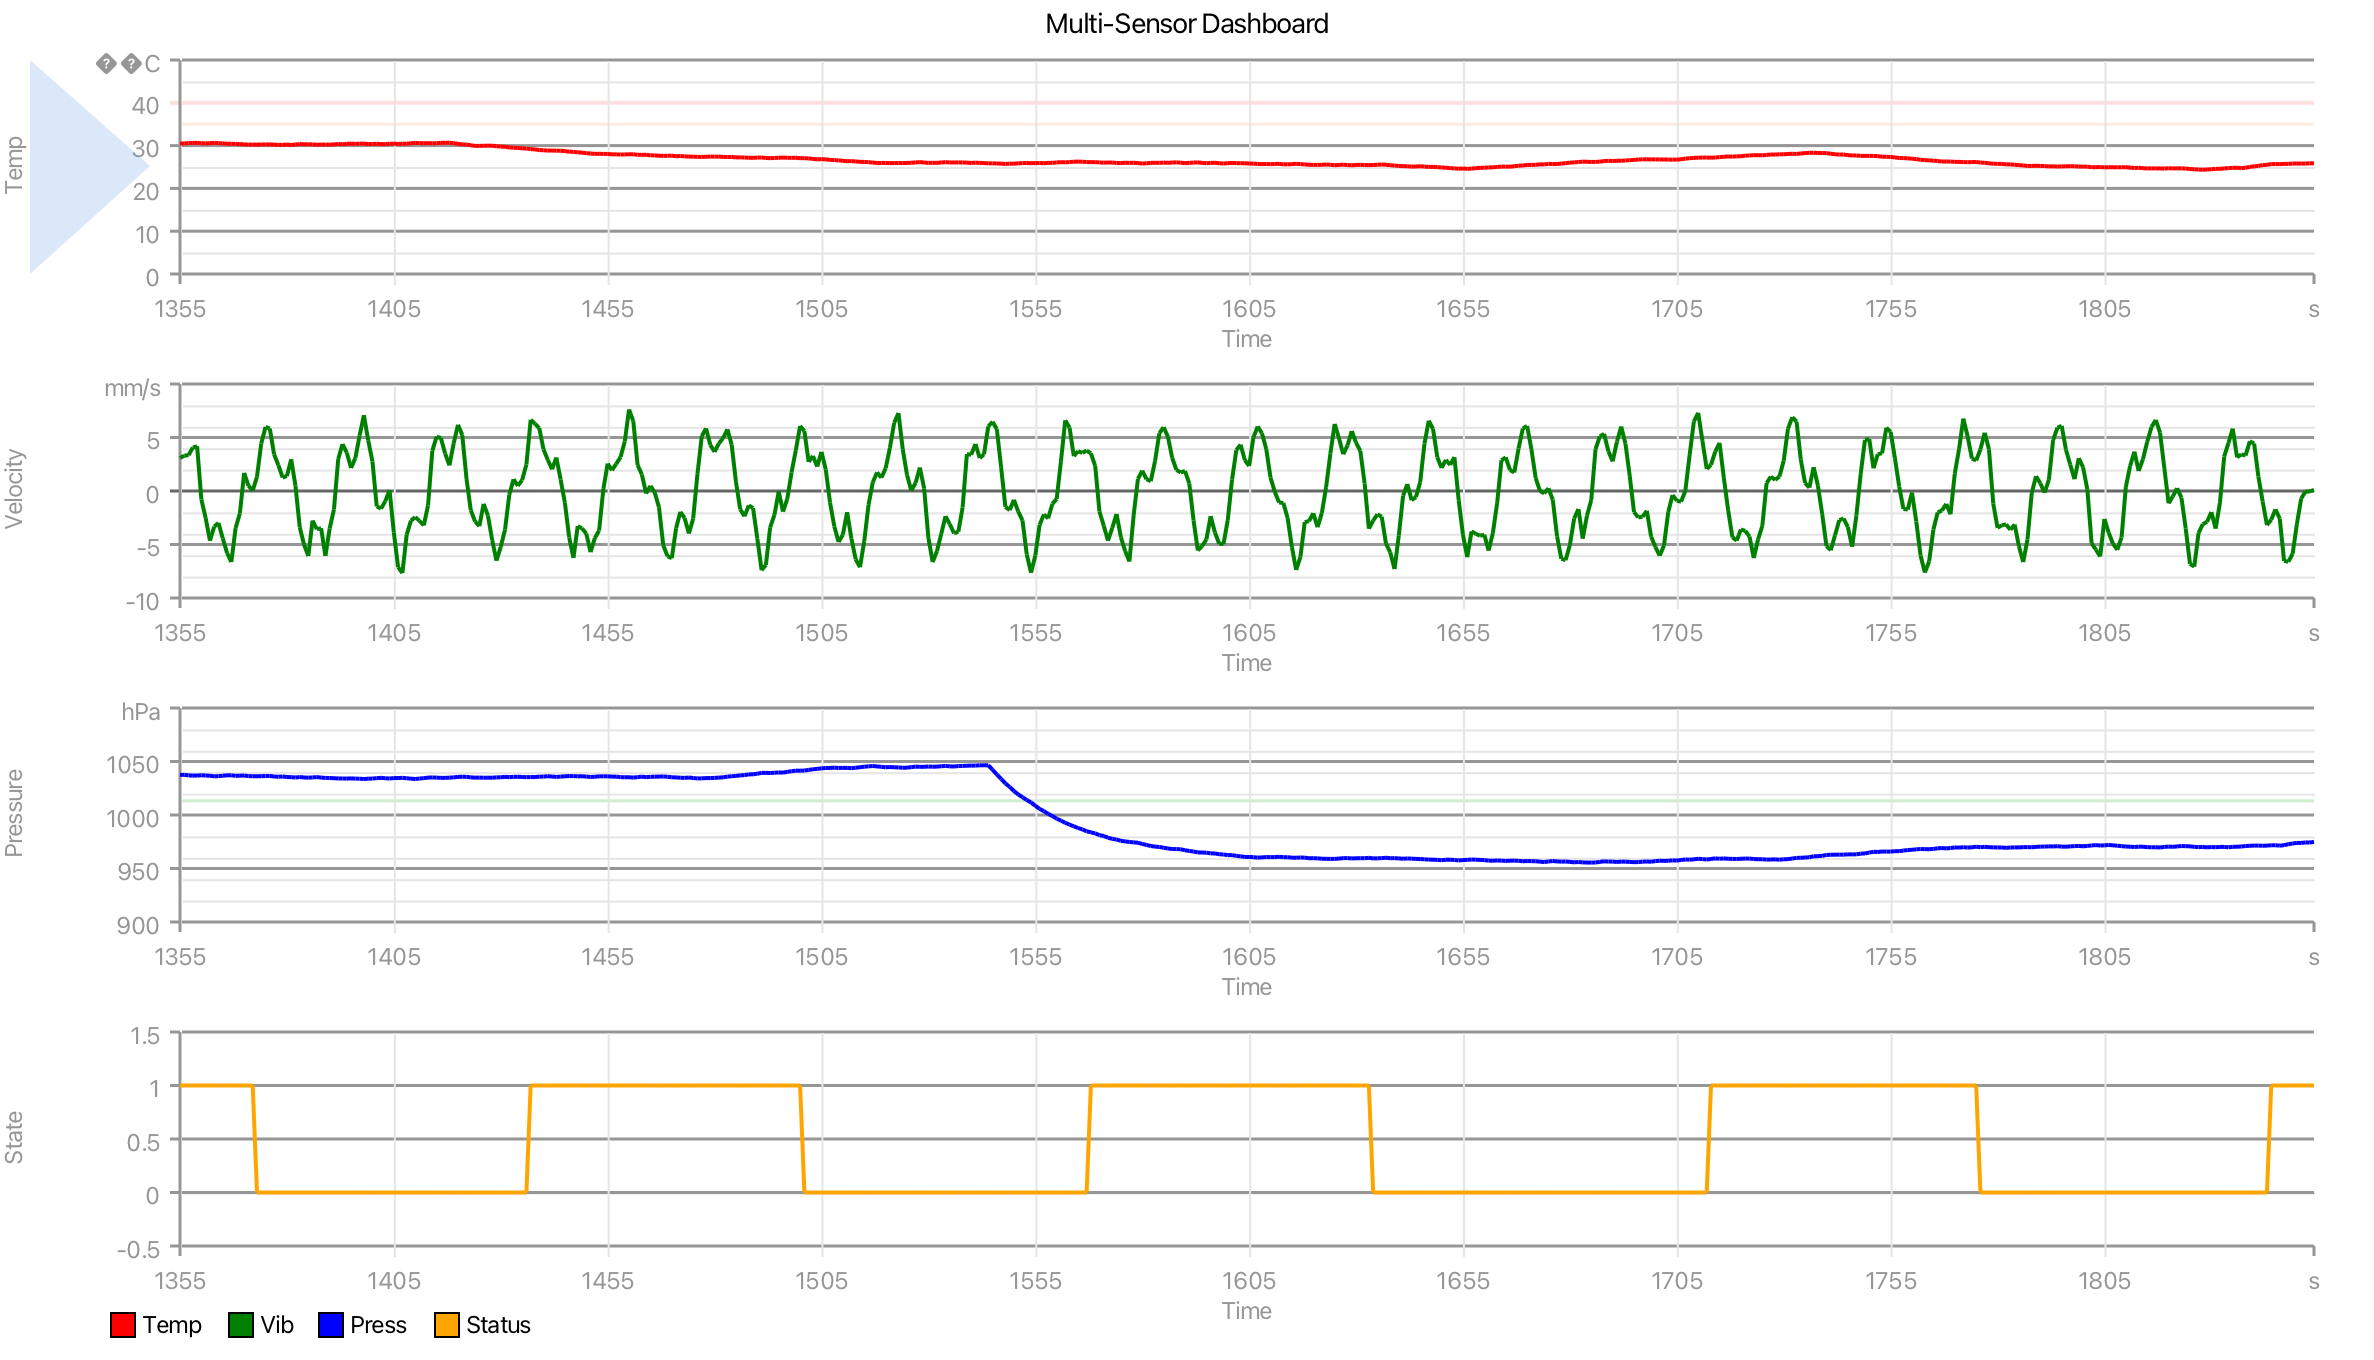
The following sequence configures a four-plot dashboard — temperature, vibration, pressure, and system status — each with its own axis range, units, and reference lines. See the Multi-Plot Stacked Monitor recipe for the sketch-side version of this layout.
[viewpoint]version=V1R1
[sketch]title=Multi-Sensor Dashboard
[cartesian]plots=4
[continuous]
[packet size]size=500
[trace labels]labels=Temp,Vib,Press,Status
[trace color]trace=0,color=F00
[trace color]trace=1,color=008000
[trace color]trace=2,color=00F
[trace color]trace=3,color=FFA500
[plot labels]plot=0,title=Temperature,x=Time,y=Temp
[axis]plot=0,axis=y,min=0,max=50.00,minor=5.0000,major=10.00
[reference line]id=0,plot=0,axis=y,value=35.00,color=21FF6600,stroke=1.5000
[reference line]id=1,plot=0,axis=y,value=40.00,color=21FF0000,stroke=2.0000
[units]plot=0,x=s,y=°C
[plot labels]plot=1,title=Vibration,x=Time,y=Velocity
[axis]plot=1,axis=y,min=-10.00,max=10.00,minor=2.0000,major=5.0000
[reference line]id=0,plot=1,axis=y,value=0,color=666,stroke=1.0000
[units]plot=1,x=s,y=mm/s
[plot labels]plot=2,title=Pressure,x=Time,y=Pressure
[axis]plot=2,axis=y,min=900.00,max=1100.00,minor=20.00,major=50.00
[reference line]id=0,plot=2,axis=y,value=1013.25,color=3100AA00,stroke=1.5000
[units]plot=2,x=s,y=hPa
[plot labels]plot=3,title=System Status,x=Time,y=State
[axis]plot=3,axis=y,min=-0.5000,max=1.5000,minor=1.0000,major=0.5000
[units]plot=3,x=s
[viewpoint]completed=true