Recipe 13 — Multiple Display Modes from the Same Frame Stream
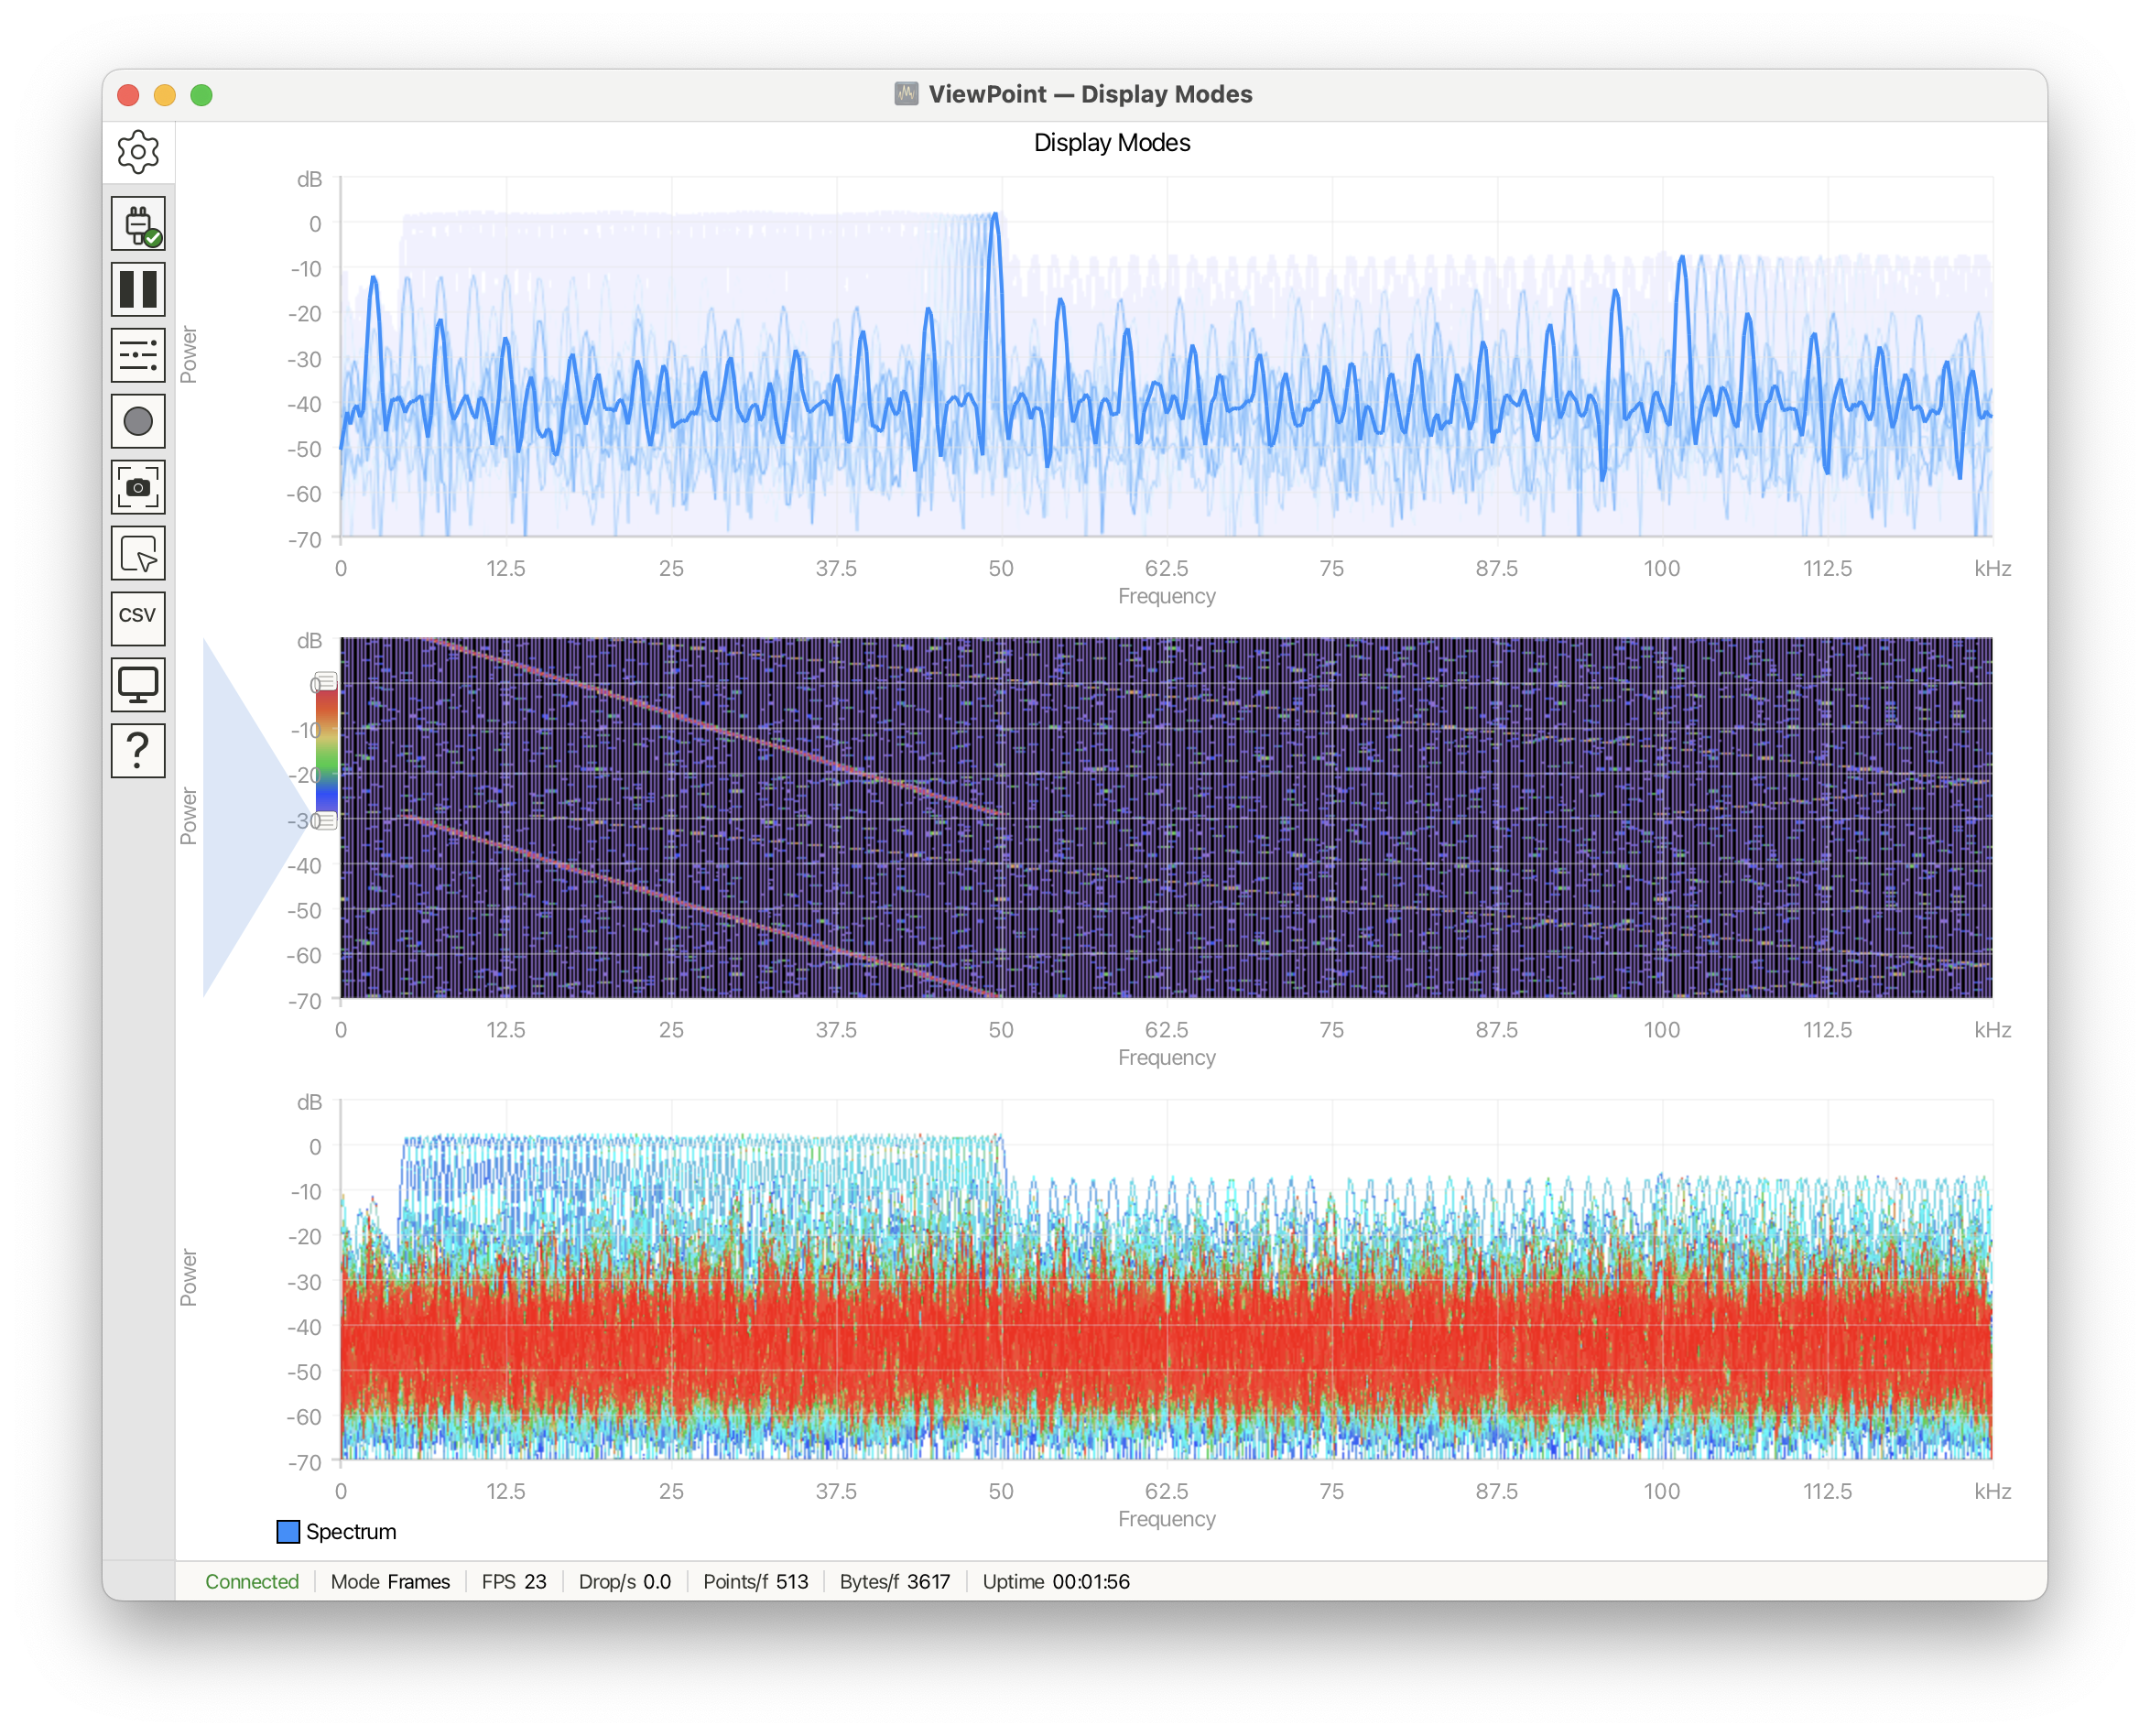
Display modes are easiest to understand when the same frame stream is rendered three different ways. This recipe uses VPDSP to generate a sweeping spectrum, then shows Persistence, Spectrogram, and Gradient on stacked plots so their different uses are directly comparable.
Note that all three plots share the same base configuration, this is easily applied by using the base plot. Individual (display mode) configuration is applied to each plot independently.
See Display Modes under the Controls panel.
Declarations and helpers
#include <ViewPoint.h>
#include <VPDSP.h>

using namespace viewpoint;

#define SAMPLE_RATE 250000
#define FFT_SIZE 1024
#define FFT_OUTPUT_SIZE (FFT_SIZE / 2 + 1)
#define CARRIER_START 5000
#define CARRIER_END 50000
#define CARRIER_STEP 500

signal_generator sig(SAMPLE_RATE);
FFT<(DSP_SIZE)FFT_SIZE> fft;
float samples[FFT_SIZE];
uint32_t carrier = CARRIER_START;
Configuration
void setup() {
    view.begin(frames, FFT_OUTPUT_SIZE);
    view.setDelay(40);
    view.setTitle("Display Modes");
    view.setNumberOfPlots(3);

    view.trace("Spectrum").setColor(colors::DodgerBlue);

    // Apply base configuration to each plot
    view.setHorizontalRange(0, SAMPLE_RATE / 2000, 10);
    view.setVerticalRange(-70, 10, 8);
    view.setAxisLabels("Frequency", "Power");
    view.setUnits("kHz", "dB");

    // Apply individual configuration to each plot
    view.plot(0).setTitle("Persistence");
    view.plot(0).setDisplayMode(persistence, 0);

    view.plot(1).setTitle("Spectrogram");
    view.plot(1).setDisplayMode(spectrogram, 0);

    view.plot(2).setTitle("Gradient");
    view.plot(2).setDisplayMode(gradient, 0);

    sig.set_carrier(shape_square, carrier);
    sig.set_AM(shape_sine, 2, 0.01);
    sig.set_noise(3.0f);
    fft.set_window_type(WIN_BLACKMAN_HARRIS);
}
Loop
void loop() {
    for (int i = 0; i < FFT_SIZE; i++) {
        samples[i] = 1.65f * sig.next_sample(0);
    }

    fft.calculate(samples);
    fft.post_scale_dB(-120, 1.65f);

    view.addData("Spectrum", (float*)fft, FFT_OUTPUT_SIZE);
    view.send();

    carrier += CARRIER_STEP;
    if (carrier > CARRIER_END) carrier = CARRIER_START;
    sig.set_carrier(shape_square, carrier);
}
What the functions do
view.begin(frames, FFT_OUTPUT_SIZE)makes each FFT output one complete frame.setDisplayMode(persistence, 0)keeps previous frames visible as fading trails.setDisplayMode(spectrogram, 0)turns each frame into a waterfall column.setDisplayMode(gradient, 0)accumulates repeated hits into a heatmap.
When to use this
- Use Persistence for transient capture and repeated overlays.
- Use Spectrogram to view amplitude as color over time.
- Use Gradient when you want to see where frame data accumulates most often.
- Keep axis ranges fixed; auto-scaling makes display-mode comparisons harder to read.
See also
examples/Cartesian/SpectrumAnalyzer/SpectrumAnalyzer.ino