Recipe 1 — Labels
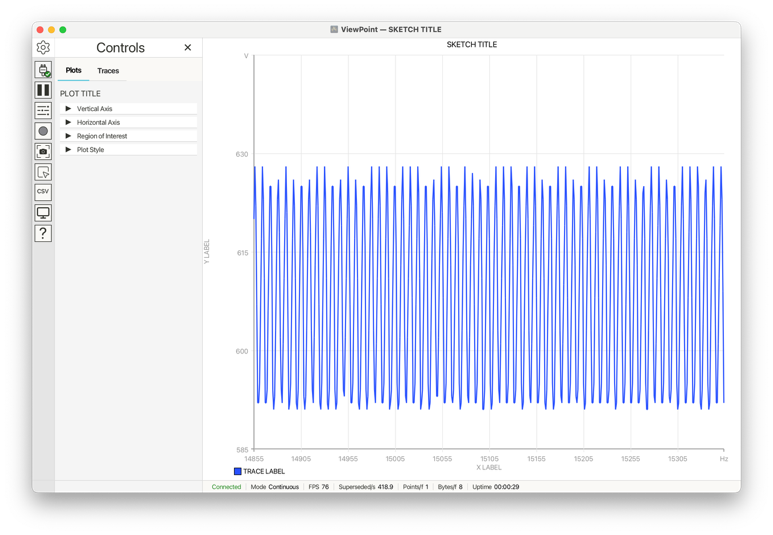
VoidLoop ViewPoint™ has separate text fields for the sketch title, plot title, axis labels, axis units, and trace labels. This recipe sets each one to a deliberately obvious value so you can match the call in the sketch to the text that appears in the desktop app. See Plot Labels.
#include <ViewPoint.h>

void setup() {
    view.begin();
    view.setTitle("SKETCH TITLE");
    view.setPlotTitle("PLOT TITLE");
    view.setAxisLabels("X LABEL", "Y LABEL");
    view.setUnits("Hz", "V");
}

void loop() {
    view.addData("TRACE LABEL", analogRead(A0));
    view.send();
}
What the functions do
setTitle()sets the sketch-level title, drawn above the plot region and in the desktop window title bar.setPlotTitle()sets the title inside the plot panel.setAxisLabels()sets axis text that is placed alongside each respective axis.setUnits()adds units that are used in analysis features and take the place of the max gridline label.addData("TRACE LABEL", ...)creates a trace by label; the label appears in the legend.