Recipe 2 — Axis Ranges and Grid Spacing
Axis ranges can be configured three ways: bounds only with derived divisions, bounds with a specified division count, or bounds with explicit minor and major step sizes. This recipe compares the three forms so you can choose between letting VoidLoop ViewPoint™ pick readable spacing, requesting a fixed number of divisions, or matching a domain-specific grid exactly. See Axis Configuration.
#include <ViewPoint.h>
void setup() {
view.begin();
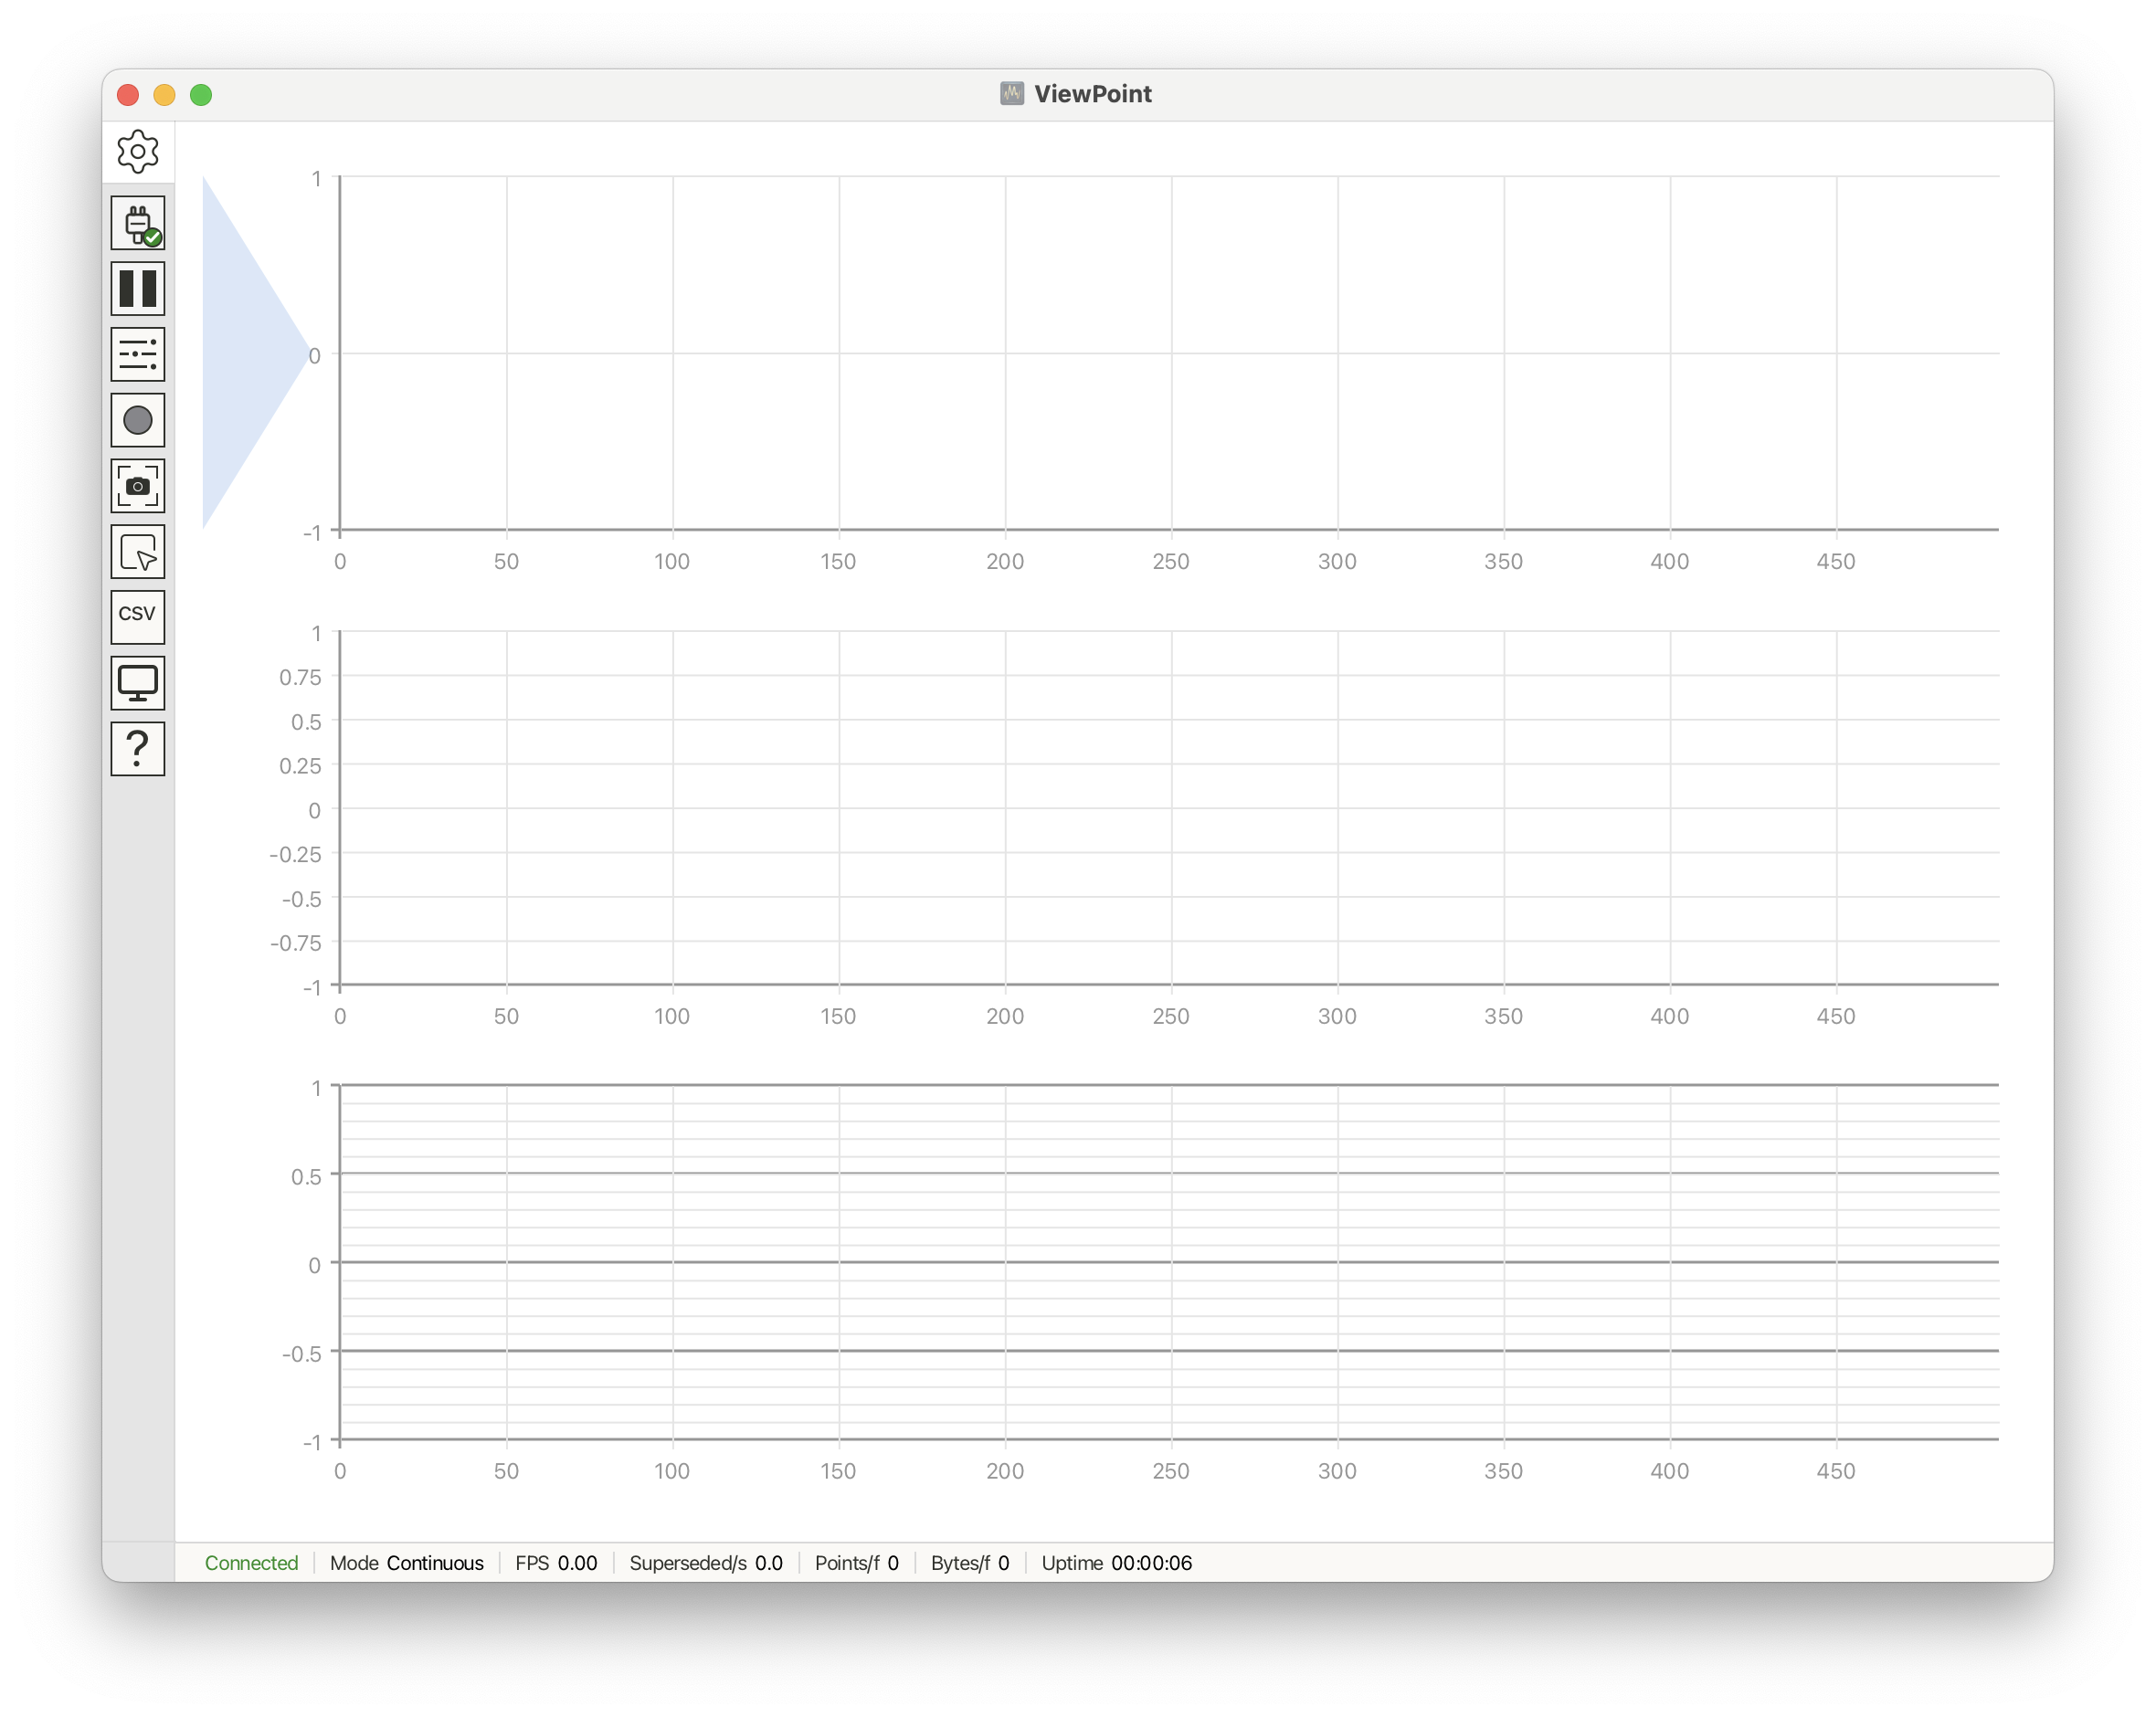
view.setNumberOfPlots(3);
view.plot(0).setTitle("min, max");
view.plot(0).setVerticalRange(-1.0, 1.0);
view.plot(1).setTitle("min, max, divisions");
view.plot(1).setVerticalRange(-1.0, 1.0, 8);
view.plot(2).setTitle("min, max, minor, major");
view.plot(2).setVerticalRange(-1.0, 1.0, 0.1, 0.5);
}
void loop() {
view.send();
}
What the functions do
setVerticalRange(min, max)sets bounds only; VoidLoop ViewPoint™ chooses readable grid spacing.setVerticalRange(min, max, divisions)splits the axis into a fixed number of equal segments.setVerticalRange(min, max, minor, major)sets explicit small and large grid spacing in data units.setTitle(...)— per-plot titles appear in the Controls panel.