Trace Configuration
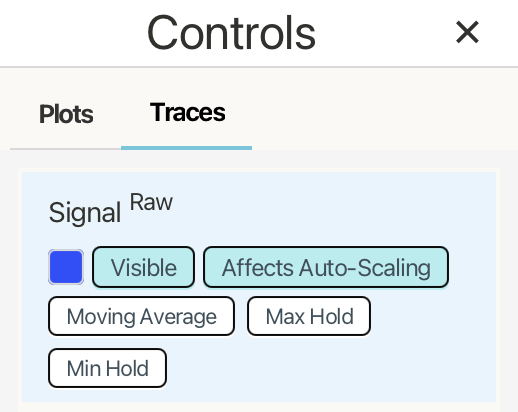
The Traces tab controls how each trace is displayed and how it participates in plot scaling and derived views. Each trace card shows the trace label, its raw or processed state, color, and available display options.
Visible shows or hides the trace on the plot. Hiding a trace does not delete it, stop the data from being received, or stop it from being saved to CSV.
Affects Auto-Scaling controls whether the trace is included when the plot automatically chooses its axis range. Turn this off when you want to keep a trace visible without letting it affect the scale of the plot.
Changing the Trace Label
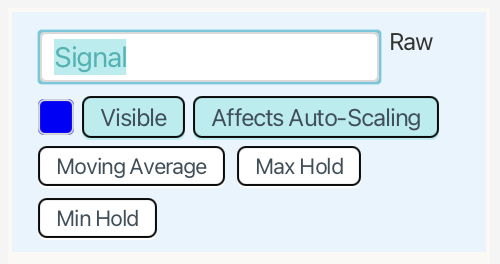
To rename a trace, click the trace label. The label becomes editable.
Type the new name, then press Enter or click away to apply the change. The updated label is used in the plot legend, markers, statistics, and other trace selection controls.
Changing the Trace Color
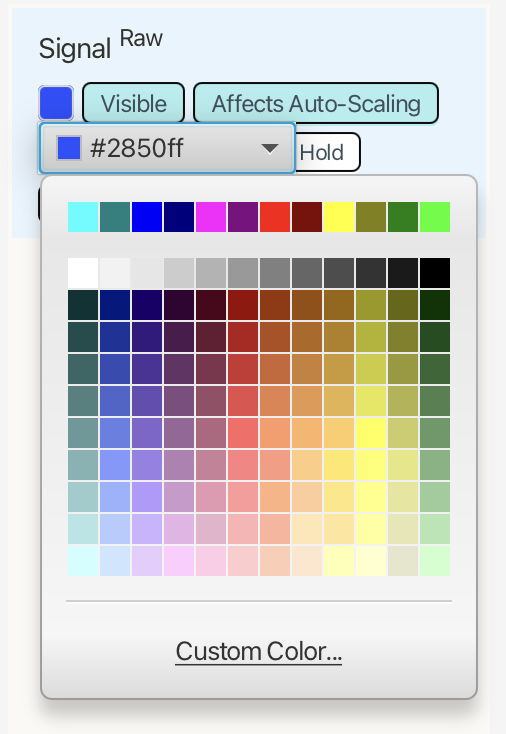
To change a trace color, click the color swatch next to the trace controls.
Choose a color from the palette, or select Custom Color to define a specific color. The new color is applied to the trace line and to matching UI indicators such as legends, markers, and statistics entries.
Derived Traces

Derived traces create a new trace from an existing trace. The original trace remains unchanged, and the derived trace appears as its own trace with its own label, color, visibility, and auto-scaling controls.
Use the derived trace buttons on a raw trace to create a processed version:
Moving Average creates a smoothed trace from the original signal. Use Sample Wt to control how strongly new samples affect the average. Lower values respond more slowly and appear smoother; higher values respond more quickly and follow the original trace more closely.
Max Hold creates a trace that holds the maximum observed value over time. Use Decay to control how quickly the held maximum falls back toward the live signal.
Min Hold creates a trace that holds the minimum observed value over time. Use Decay to control how quickly the held minimum rises back toward the live signal.
Each derived trace can be shown or hidden with Visible and included or excluded from auto-scaling with Affects Auto-Scaling.
Use Reset to clear the derived trace history and start its calculation again from the current signal. Use Remove to delete the derived trace.