Analysis
The Analysis panel provides signal inspection tools including live markers, reference lines and bands, and trace statistics.
These tools work directly on the traces shown in the plots, making them useful for identifying peaks, measuring spacing or amplitude differences, tracking thresholds, and summarizing signal behavior while data is streaming or while paused.
Markers
- Standard — place a marker at a specific point to read its value.
- Delta — measure the difference between two points.
- Harmonic — display harmonic series markers.
- Spanning — mark a range on the trace.
- Peak Lock — automatically track the peak value.
All marker sub-panels include similar UI for traversing peaks and traversing traces manually. This UI is explained explicitly in the Standard Markers section below.
Standard Markers
| XY readout | Peak-lock readout |
|---|---|
 |
 |
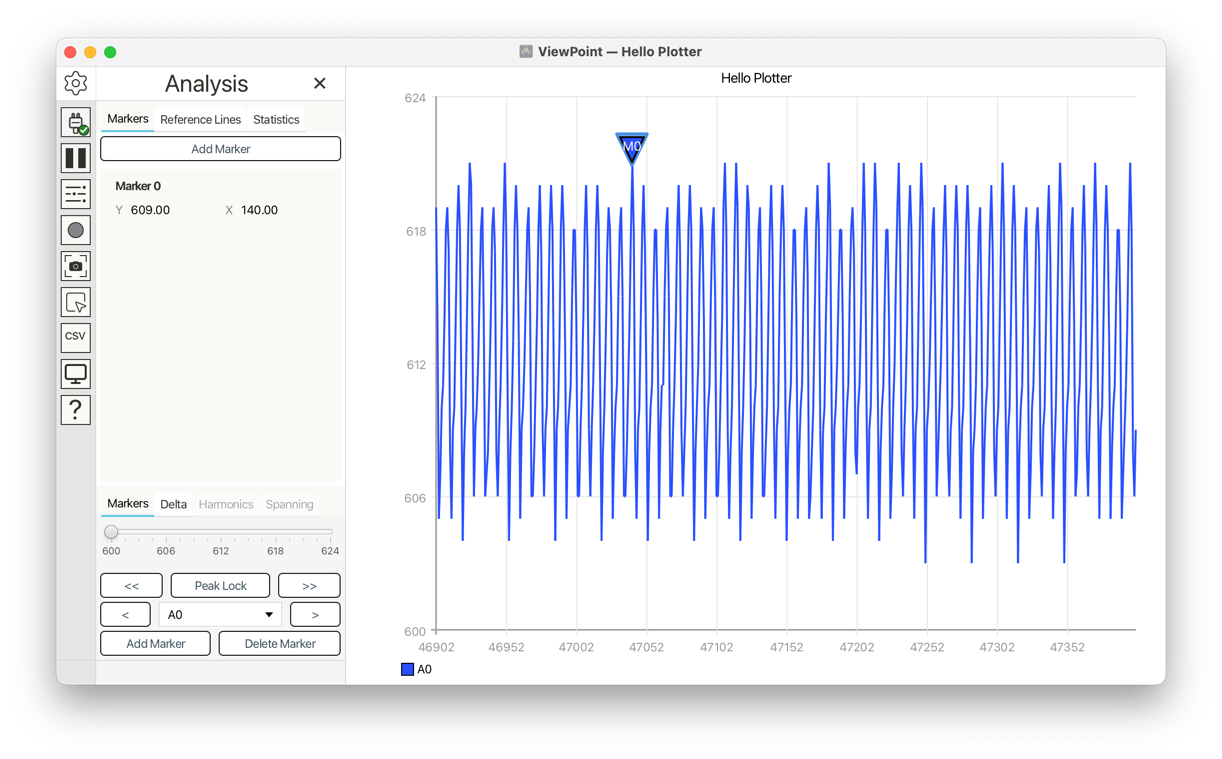
Each marker in the collection has an ID, the plot number, and trace name. For standard markers the Y value is on the left and the X value is on the right. Peak lock enabled is shown on the right.
The Threshold slider sets the minimum value used during peak searches. Values below the threshold are ignored.
Peak Lock locks the marker to the current peak and attempts to track that peak as it moves across the plot.
Use << and >> to search for the previous or next peak respectively.
Use < and > to move the marker manually, one point at a time. Hold either button to move between points more quickly.
Use the trace dropdown to choose which trace the marker analyzes.
Add Marker creates a new marker, while Delete Marker removes the currently selected marker.
Delta Markers
| Delta readout | Delta marker pair on a plot |
|---|---|
 |
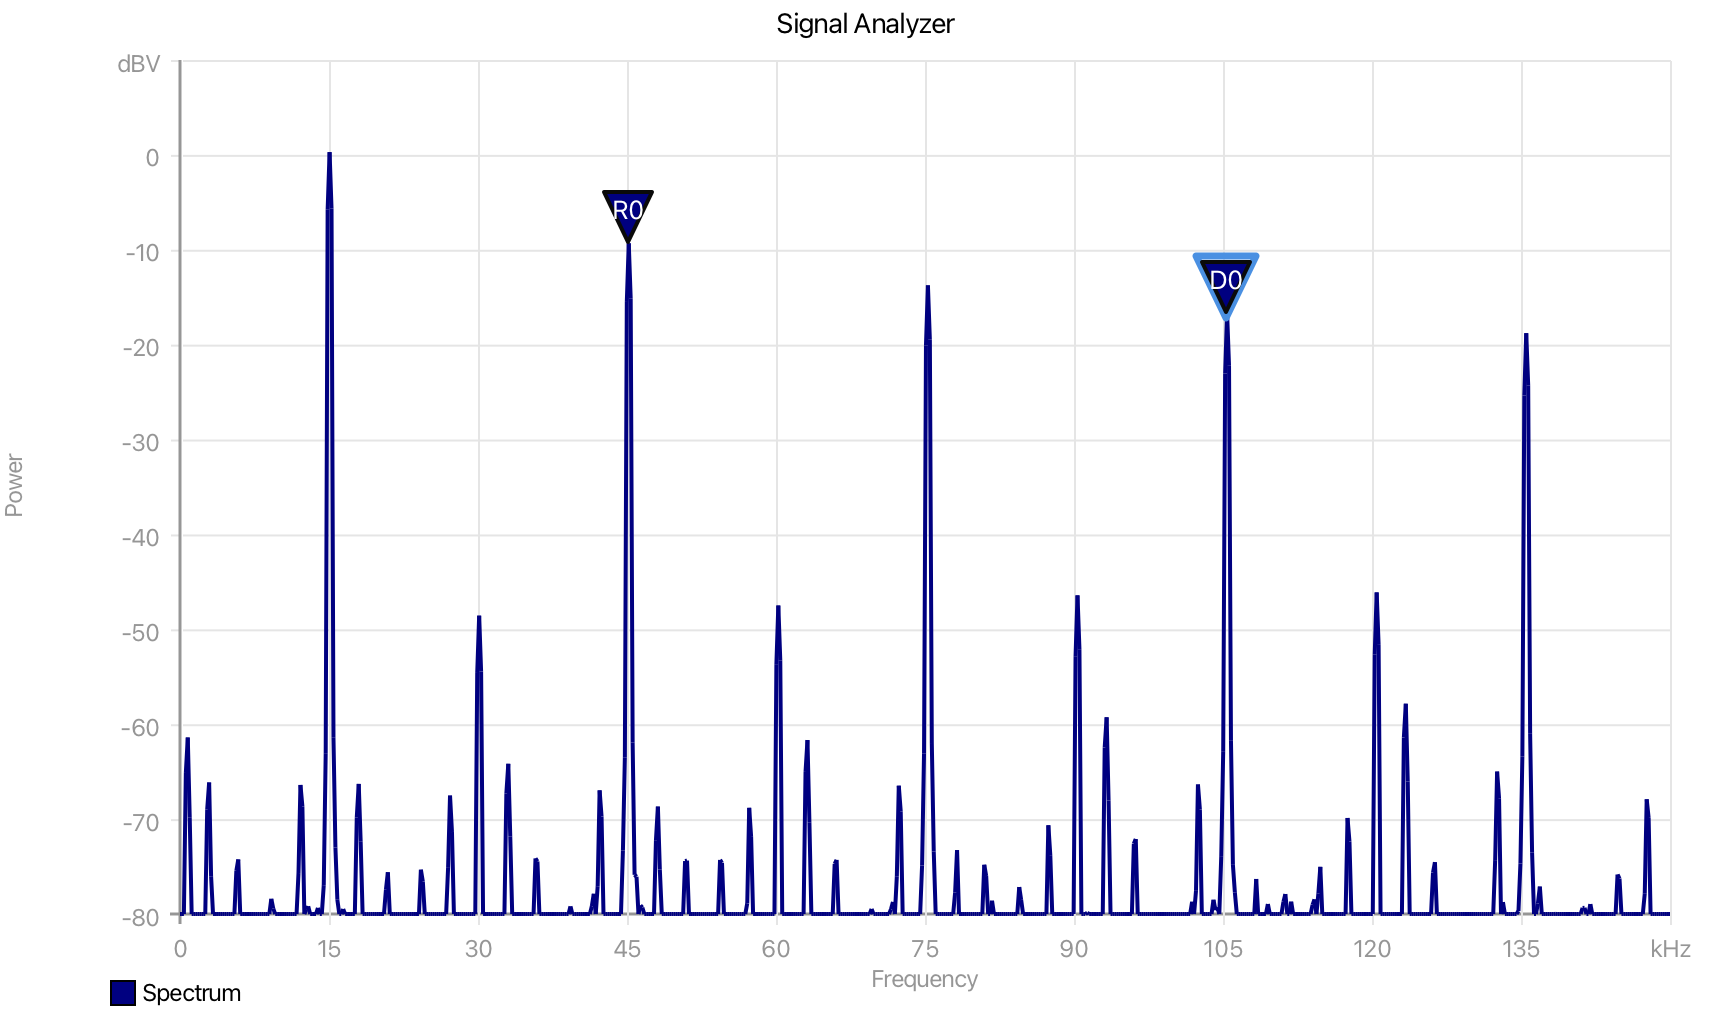 |
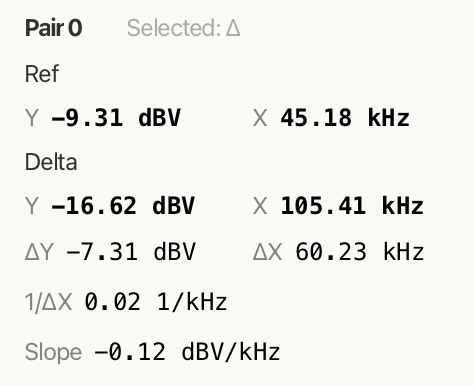
The Delta panel measures the difference between two linked markers: a reference marker and a delta marker.
Ref shows the position and value of the reference marker.
Delta shows the position and value of the second marker in the pair.
ΔY displays the vertical difference between the two markers, while ΔX displays the horizontal difference. These values are useful for comparing amplitude and frequency spacing between two points on the plot.
1/ΔX displays the inverse of the horizontal spacing. For frequency plots, this can be useful when relating frequency spacing to time or period.
Slope shows the rate of change between the two markers, calculated from the vertical difference over the horizontal difference.
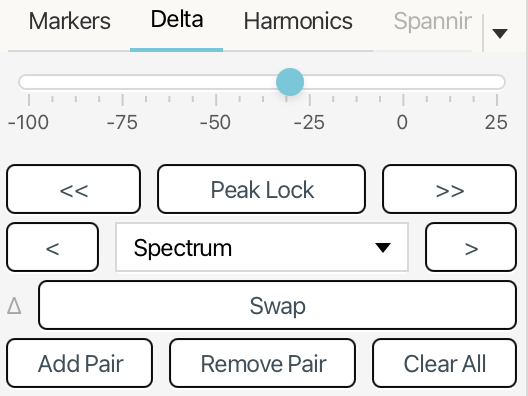
The Threshold slider, Peak Lock, peak search buttons, manual movement buttons, and trace dropdown work the same way as in the Markers panel, but apply to the currently selected marker in the delta pair.
Use Swap to exchange the reference and delta markers in the selected pair.
Add Pair creates a new delta marker pair. Remove Pair deletes the currently selected pair. Clear All removes all delta marker pairs.
Harmonic Markers
| Harmonics readout | Harmonic markers on a plot |
|---|---|
 |
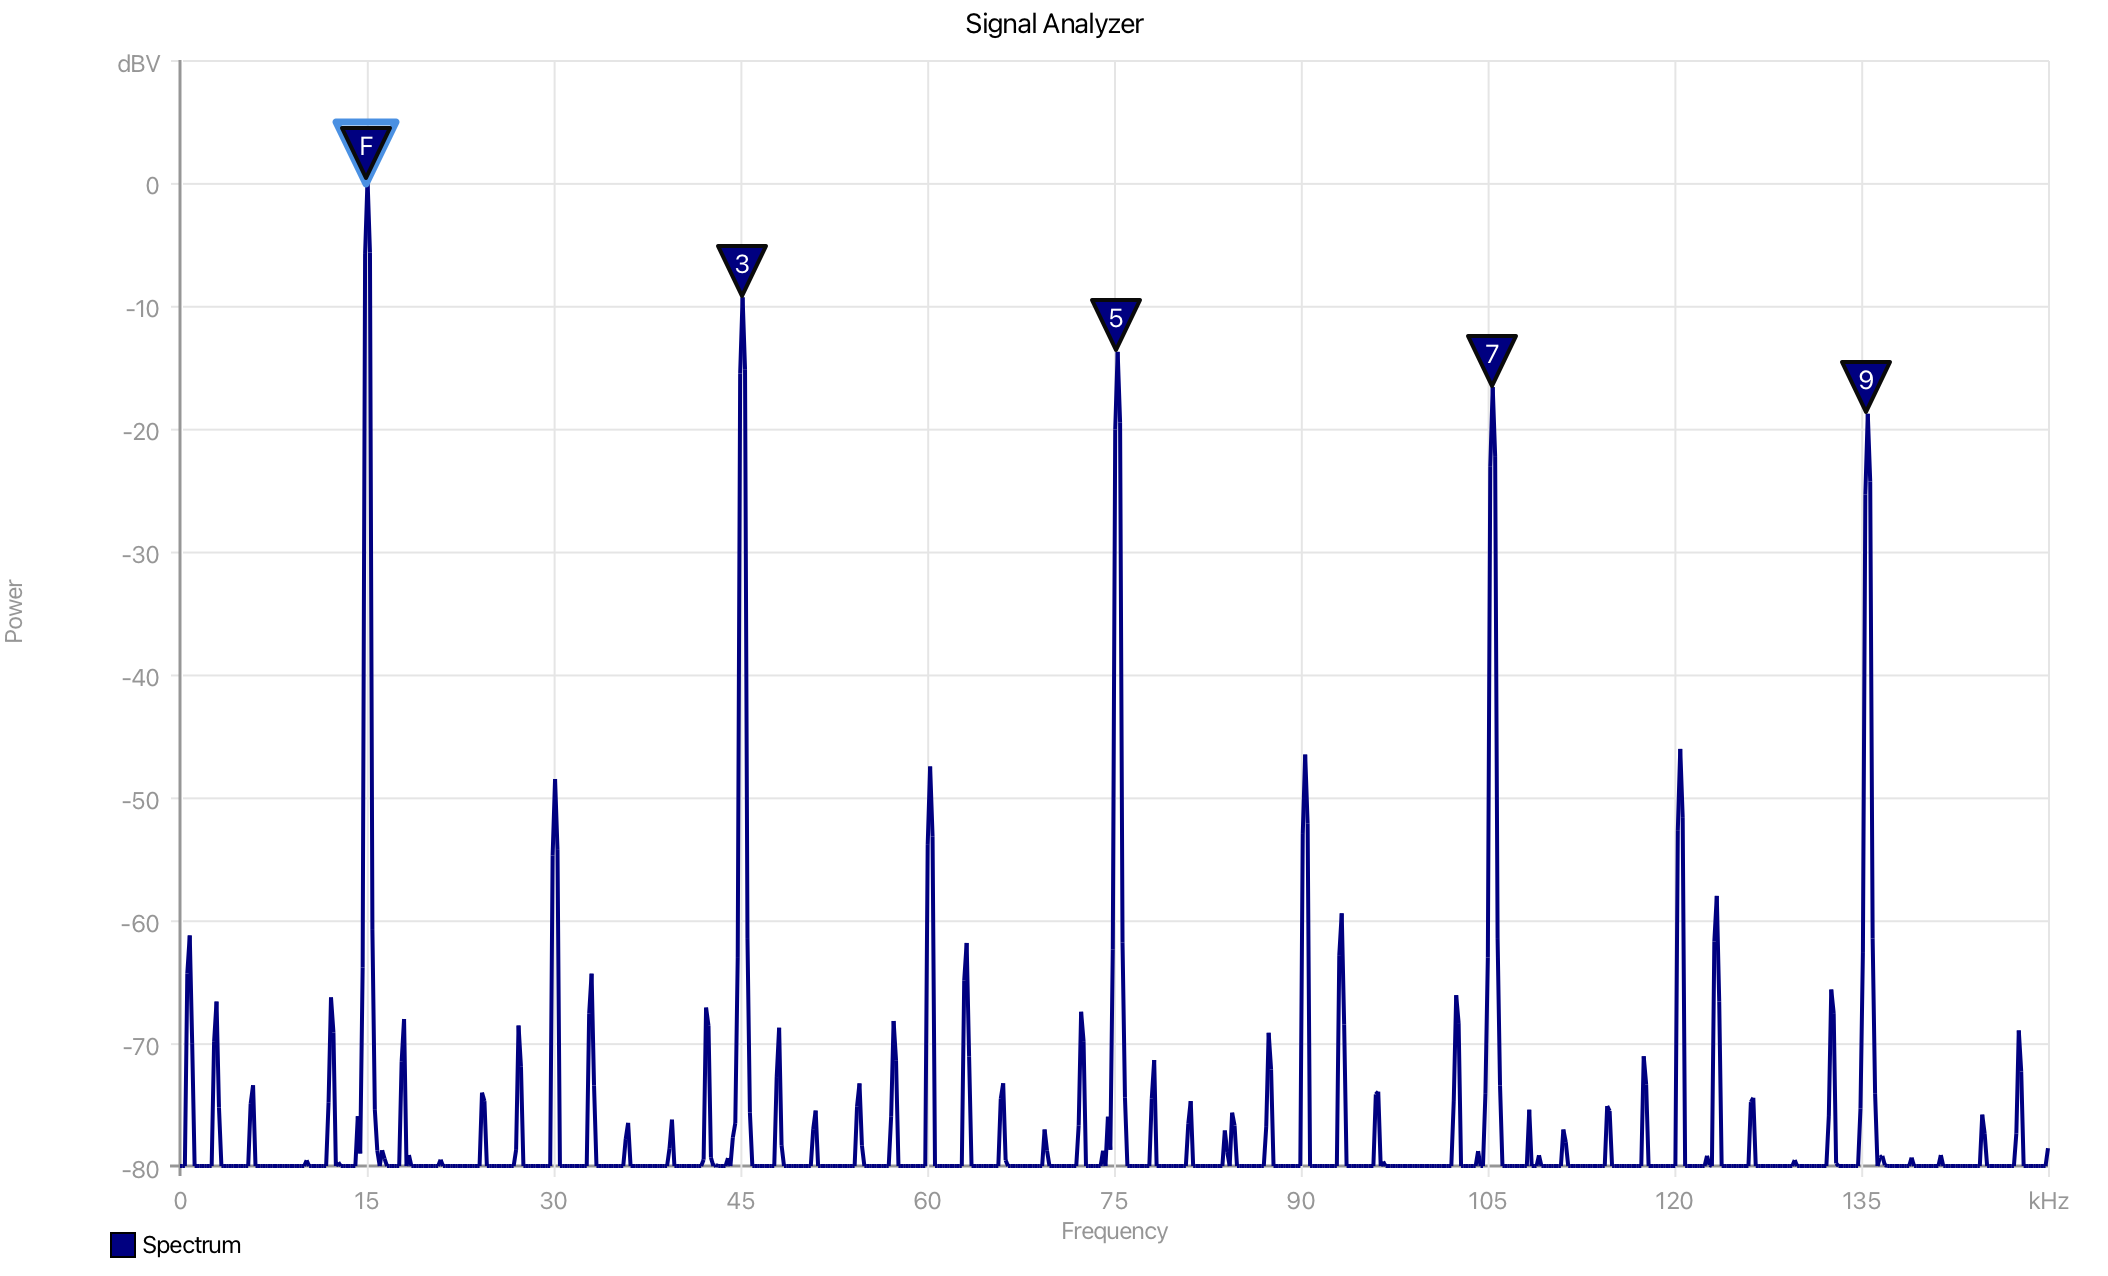 |
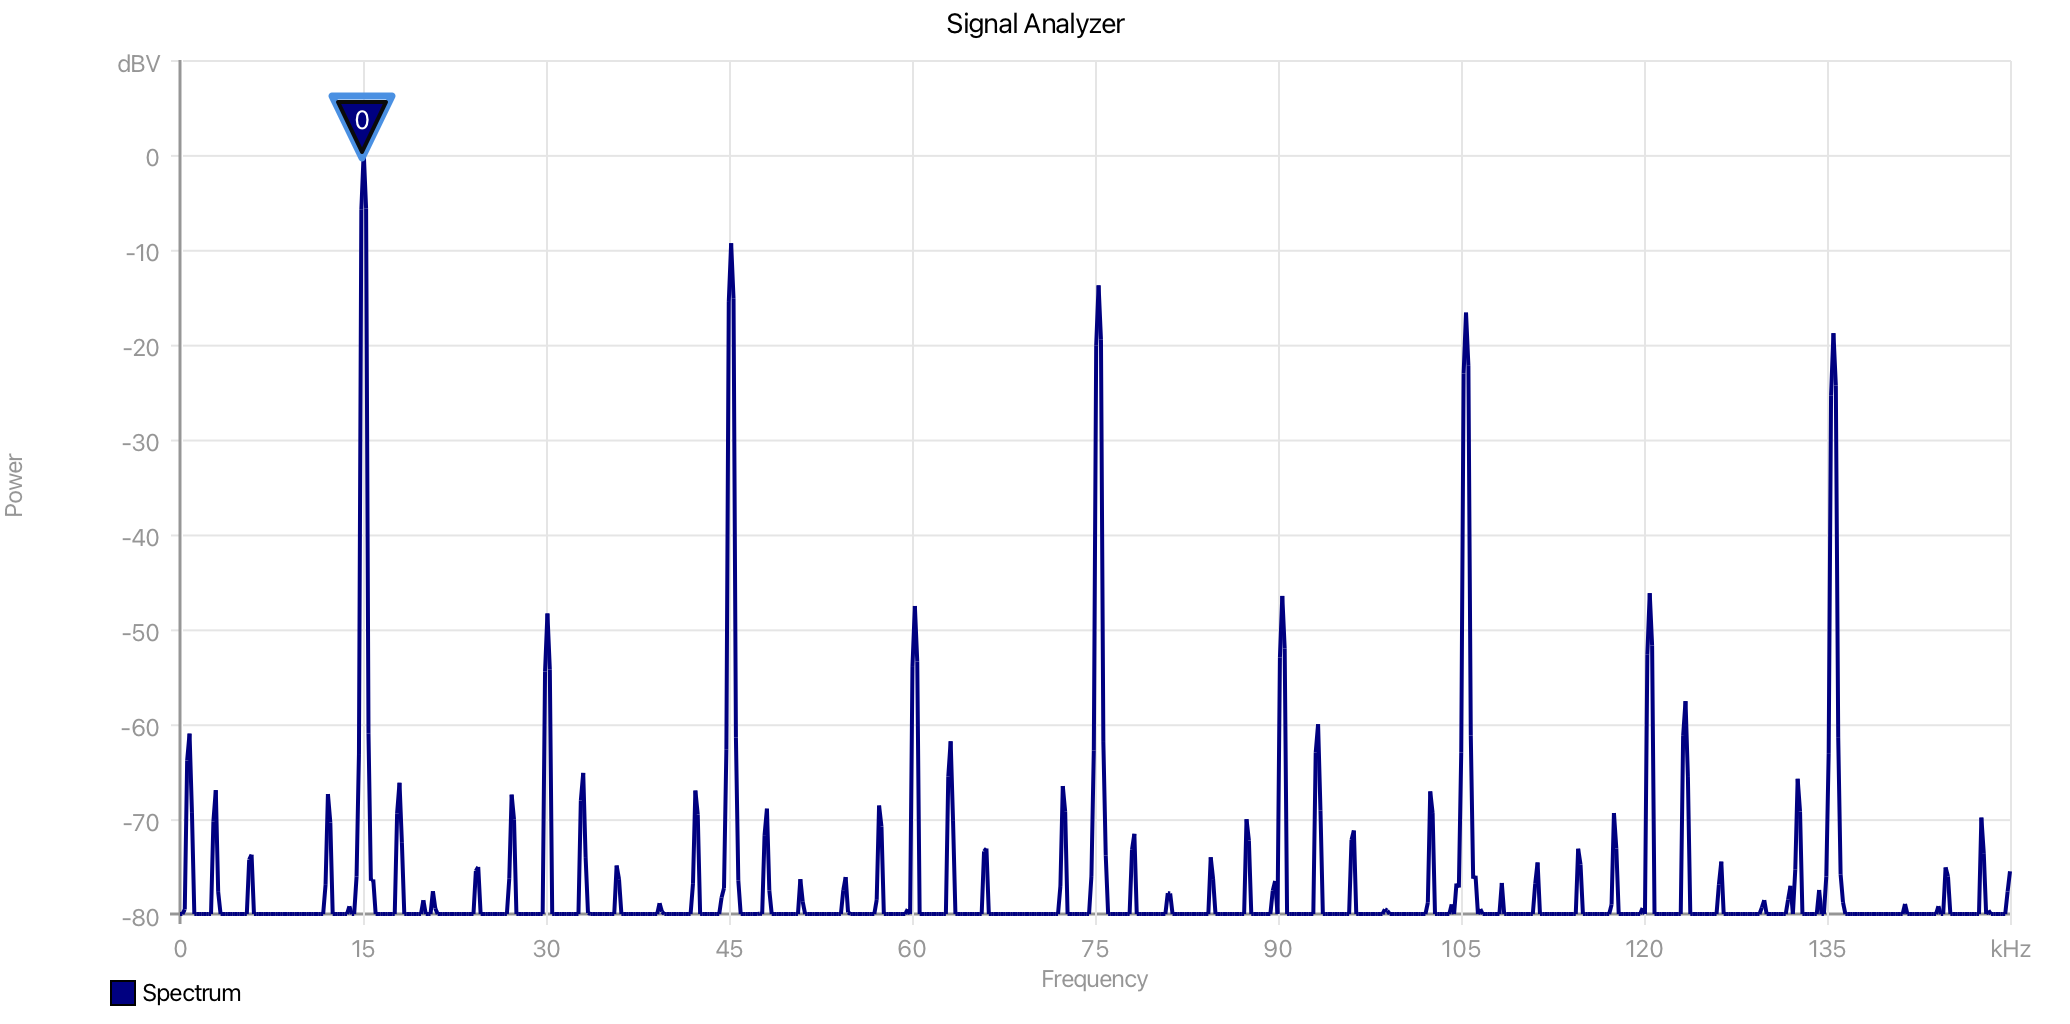
The Harmonics markers find and label harmonics related to a selected fundamental frequency.
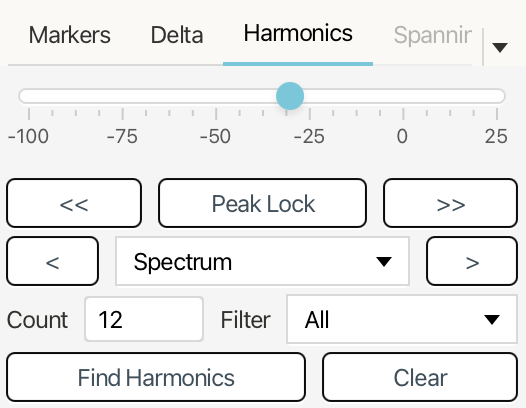
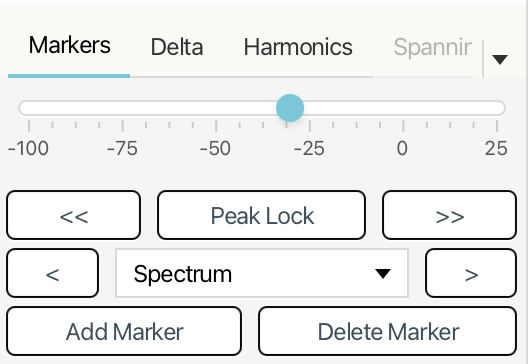
The F marker will automatically attempt to find the fundamental frequency; however, you can use the marker controls to position the fundamental marker on the frequency you want to analyze. Peak Lock, peak search, manual movement, and the trace dropdown work the same way as in the Markers panel.
Count sets the highest harmonic number to search for.
Filter controls which harmonics are shown in the results.
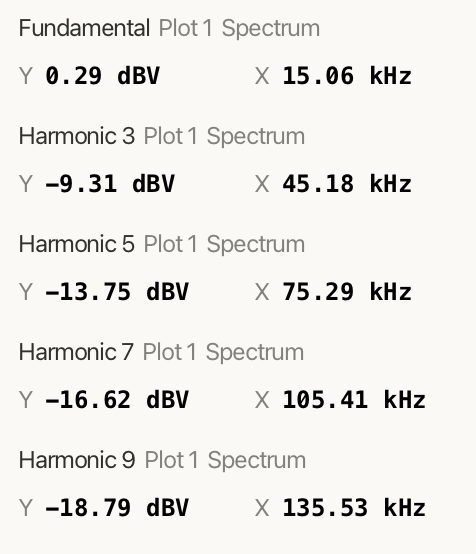
Use Harmonics Markers to search for harmonics based on the selected fundamental. Detected harmonics are marked on the plot and listed with their harmonic number, trace name, amplitude, and frequency.
The results list shows the Fundamental first, followed by detected harmonics such as Harmonic 3, Harmonic 5, and so on. Each entry reports the marker's Y value and X position.
Use Clear to remove the harmonic markers and results from the plot.
Spanning Markers
| Spanning readout | Spanning window explorer |
|---|---|
 |
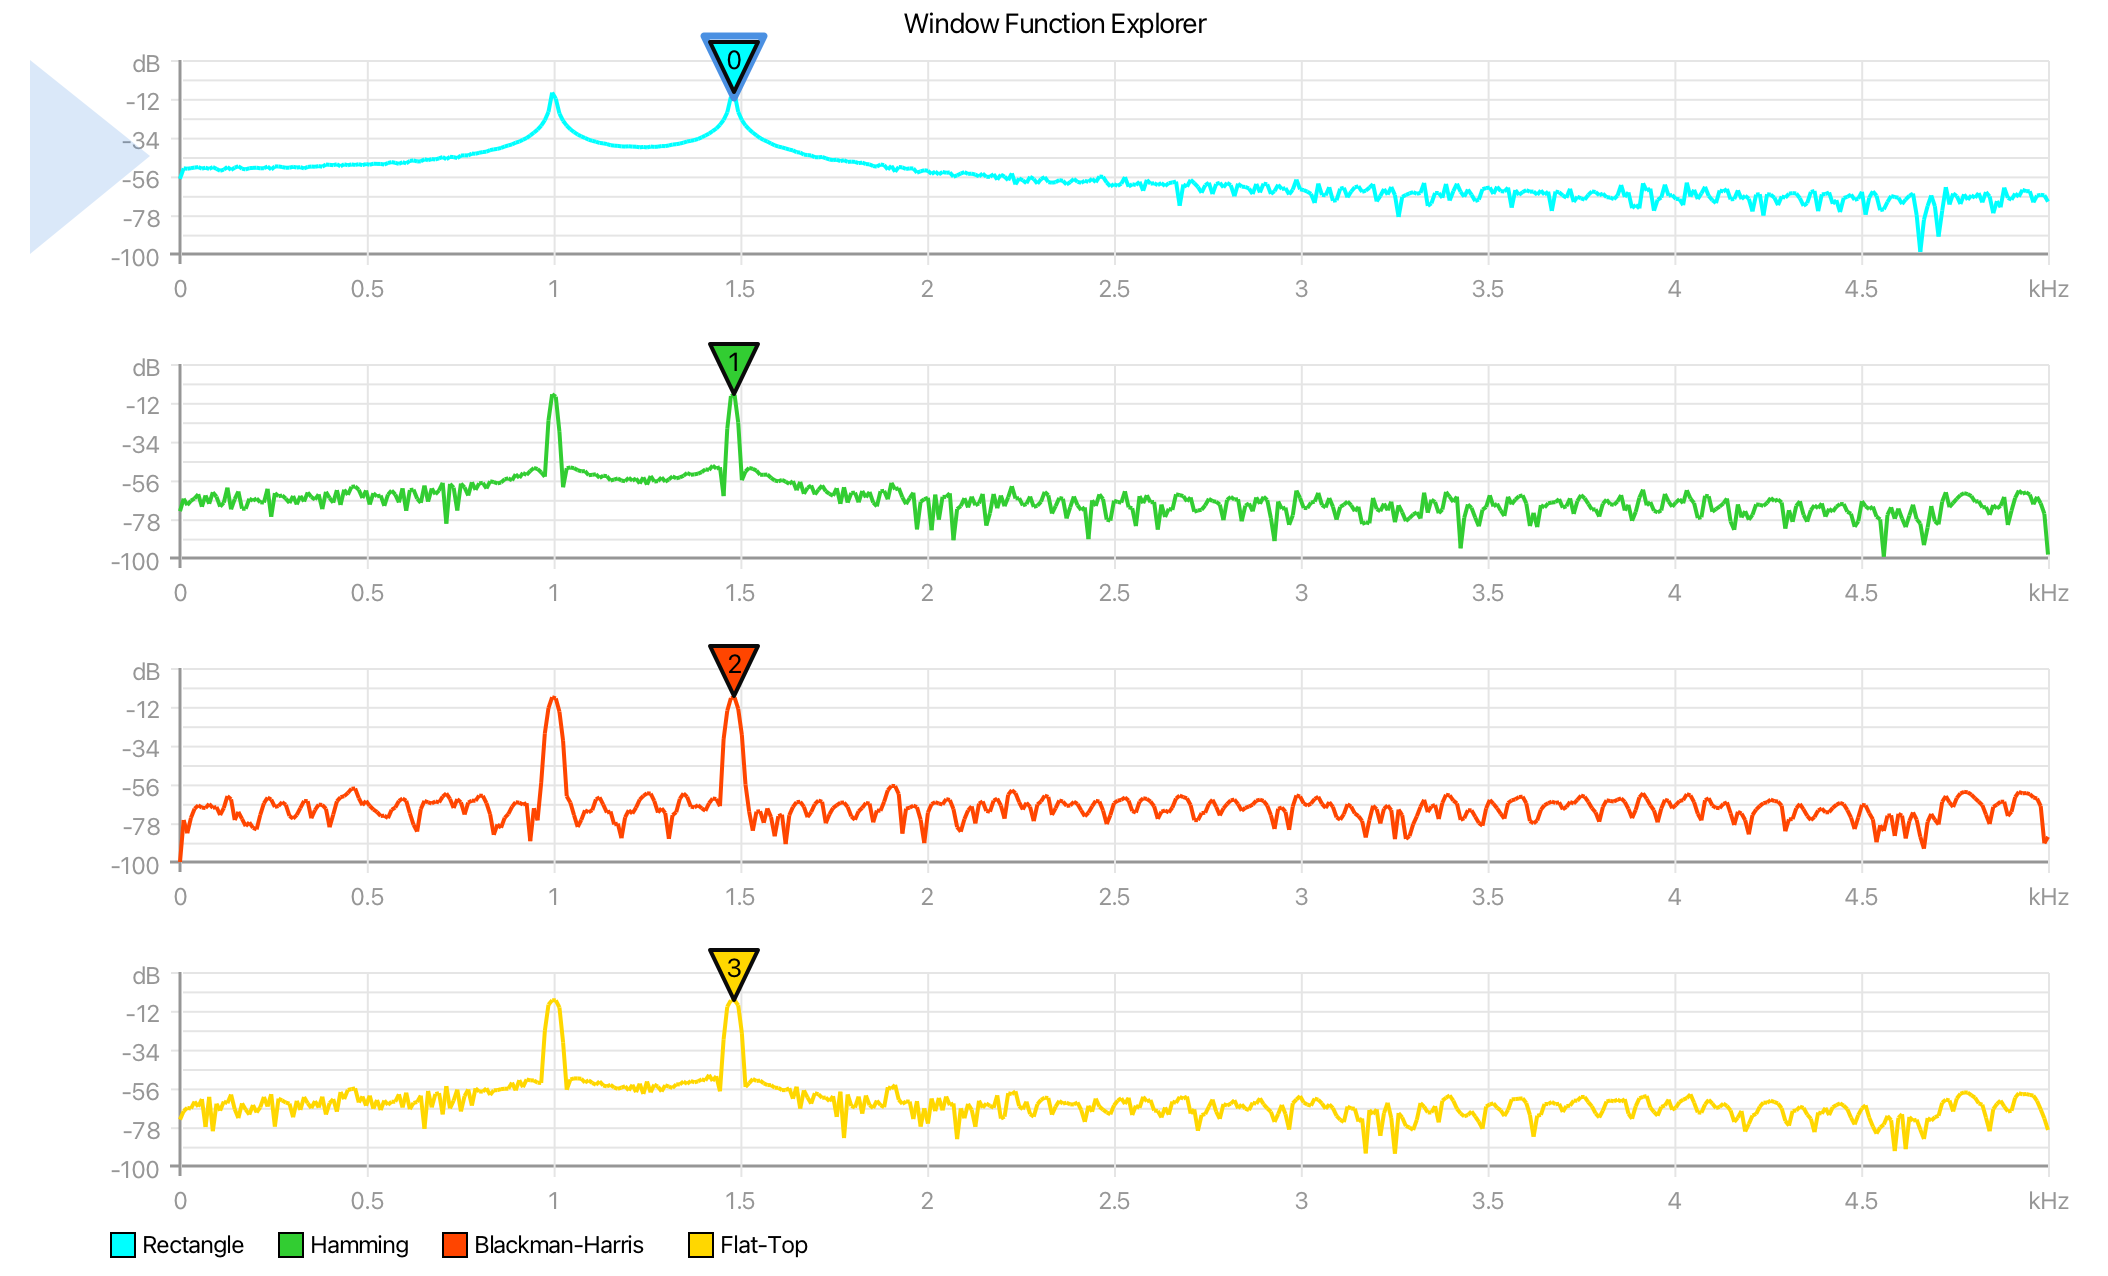 |
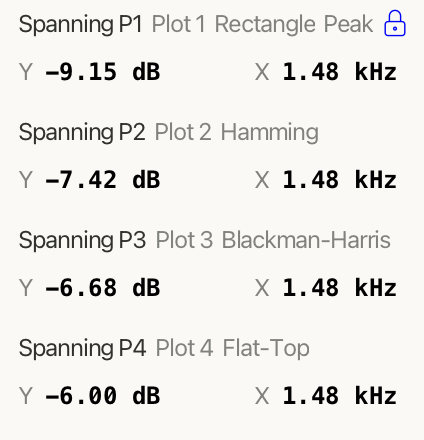
The Spanning panel places linked markers at the same sample index across multiple plots. This makes it easier to compare what is happening at the same point in the data across different views, such as a signal plot and its spectrum.
Use the slider to move the spanning marker through the shared data index.
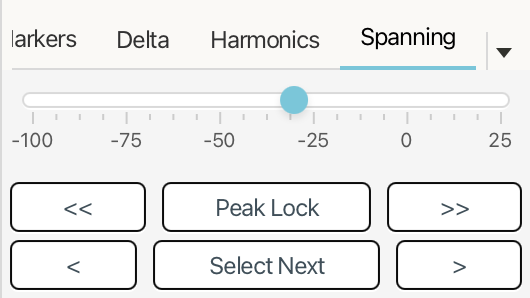
Peak Lock locks the selected spanning marker to the current peak and attempts to follow that peak as it moves.
Use << and >> to search for the previous or next peak.
Use < and > to move the spanning marker manually, one point at a time. Hold either button to move through points more quickly.
Use Select Next to switch which spanning marker is currently selected.
The results list shows one entry for each plot where the spanning marker is visible. Each entry reports the marker name, plot name, trace name, Y value, and X position for that plot.
Reference Lines and Bands

The Reference Lines panel adds horizontal or vertical guide lines to the selected plot. Reference lines can be fixed at a value, track a live trace statistic, or change visibility based on how often a trace crosses the line.
Use Add Line to create a new reference line on the current plot. Use Remove to delete the selected line. If multiple plots are available, Clone to All copies the selected line to the other plots.
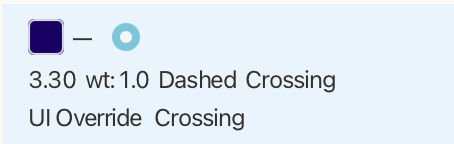
Axis chooses whether the line belongs to the X or Y axis. Value sets the line position for modes that use a fixed value. Label adds optional text next to the line.
Color, Stroke, and Style control the line's appearance. Enabled shows or hides the line without deleting it.
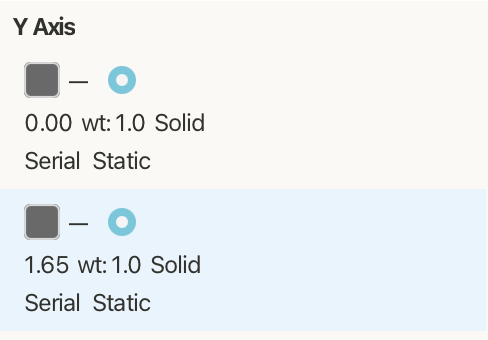
The list shows the reference lines for each axis. Each entry includes the line color, label, value, stroke weight, style, mode, and whether the line is enabled.
Static
Static mode places the reference line at a fixed axis value.
Use Value to set the exact position of the line. Static lines are useful for marking thresholds, limits, expected levels, or other constant reference points.
Tracking
![]()
![]()
Tracking moves the reference line automatically based on a statistic from a selected trace.
![]()
Use Source Trace to choose the trace the line follows. Use Statistic to choose the value to track, such as minimum, maximum, mean, RMS, standard deviation, or latest value.
Tracking lines update as the plotted data changes. This is useful for showing a live RMS level, average value, peak level, or other changing measurement directly on the plot.

Use the quick add menu at the top of the collection to add frequently used values.
The VoidLoop ViewPoint™ library can add and update reference lines based upon data using
updateVerticalReferenceLine and updateHorizontalReferenceLine for more custom
tracking.
Crossing Feedback
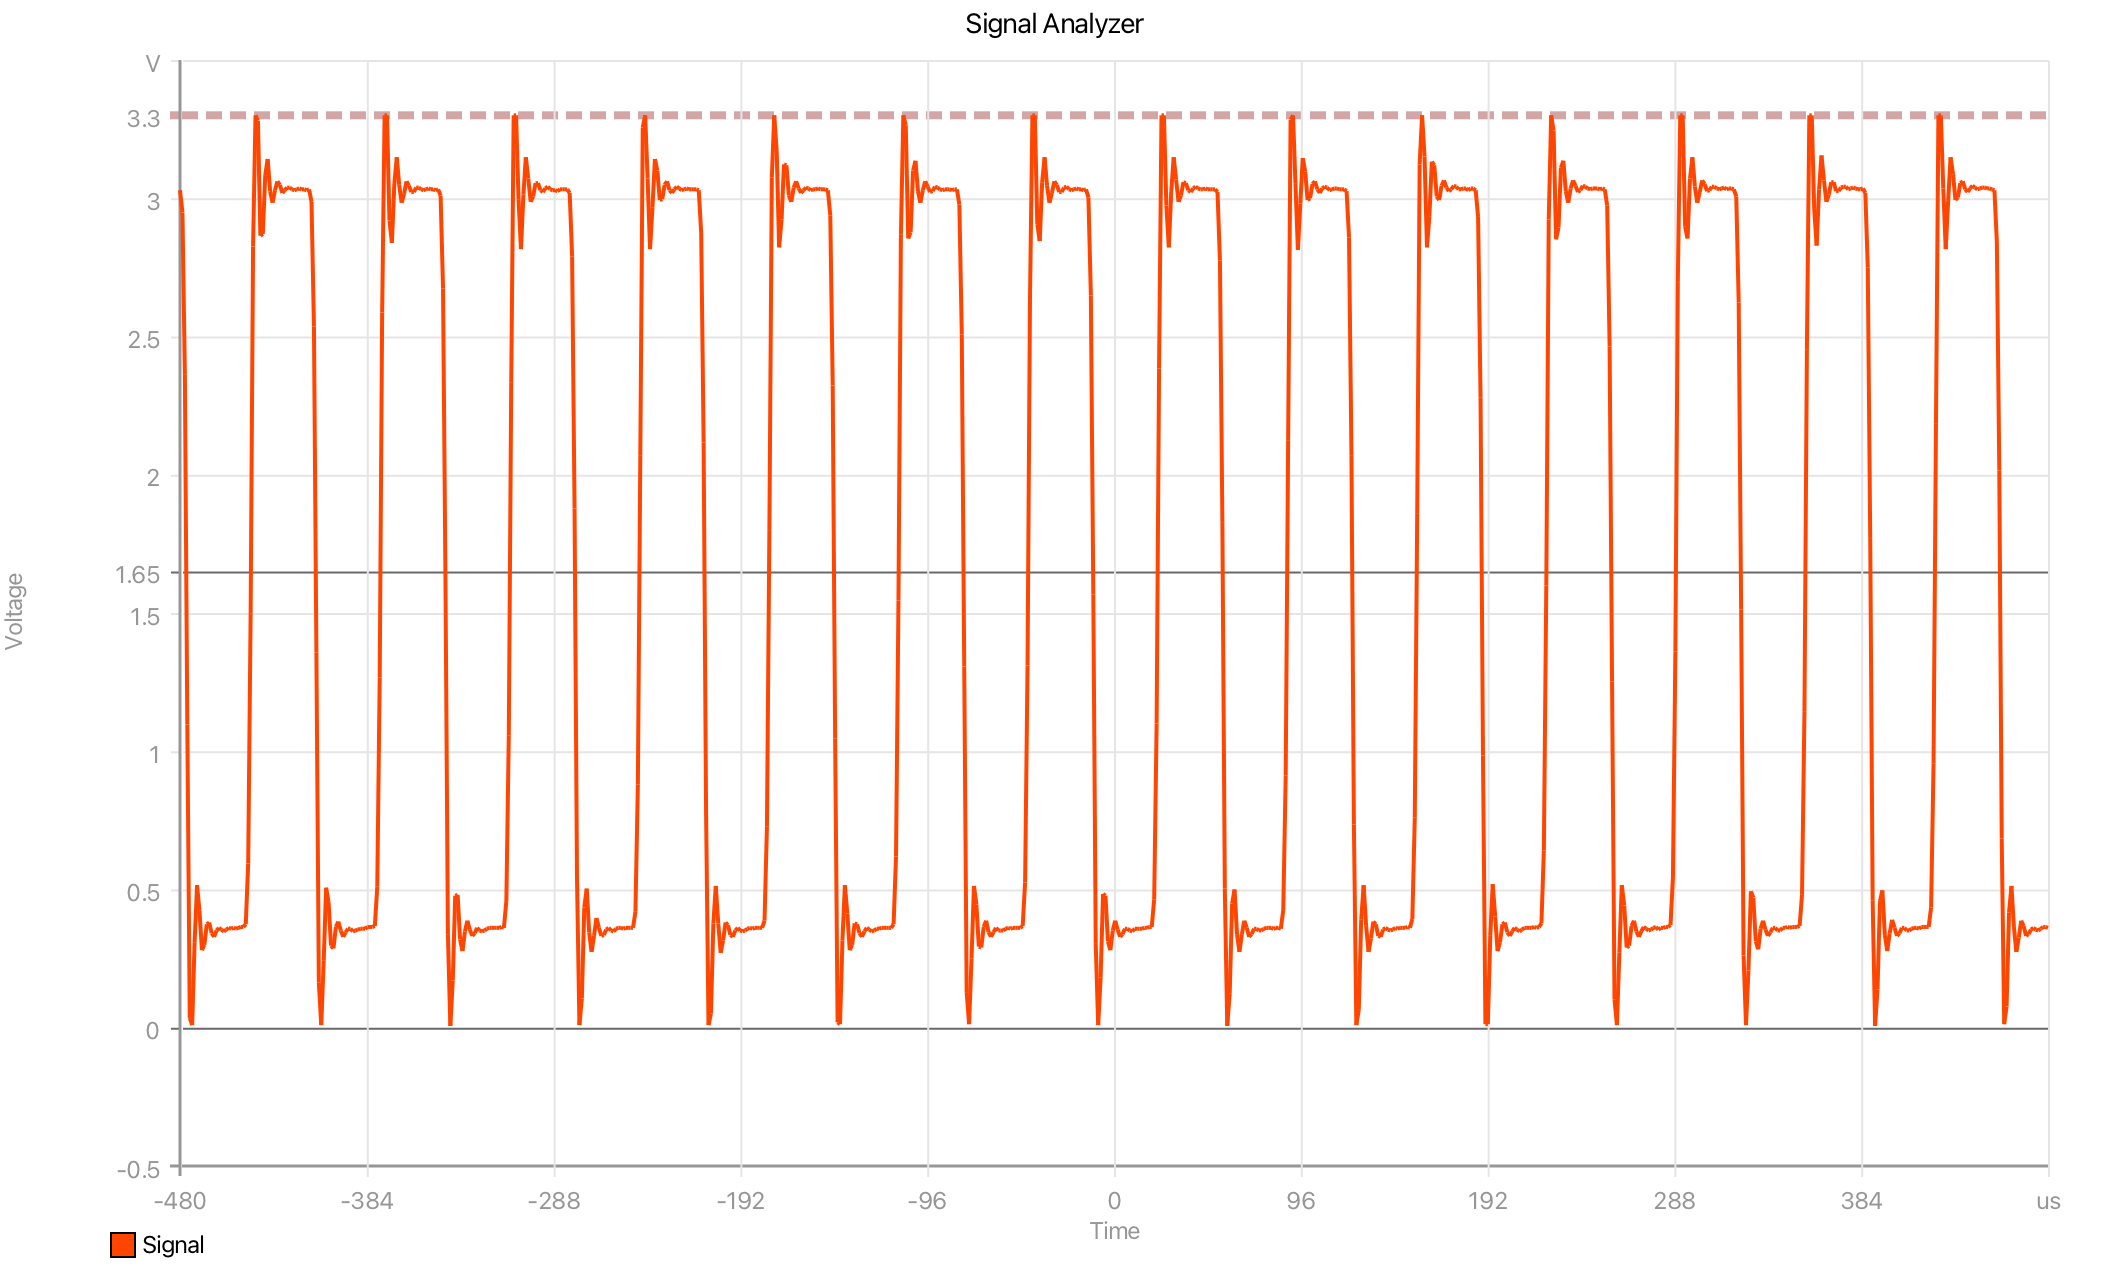
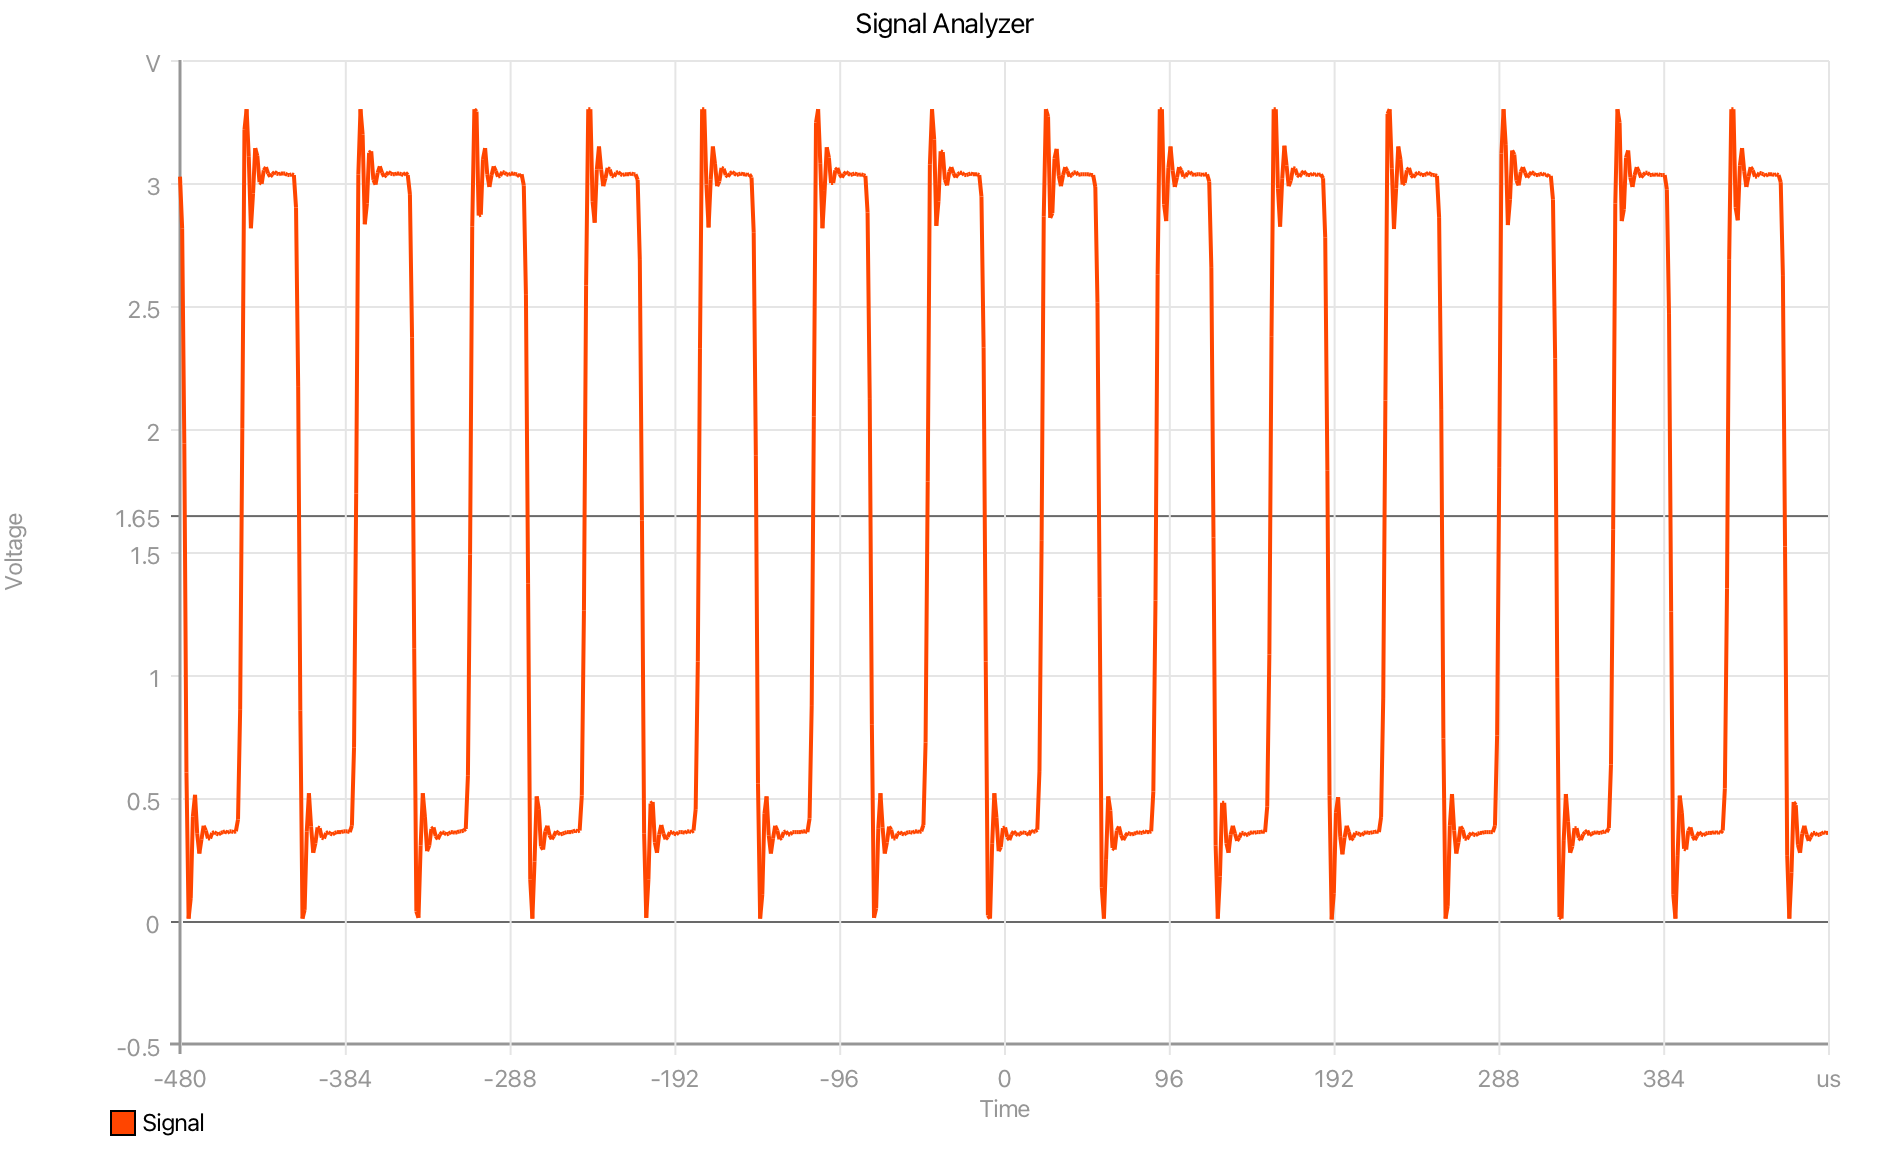
Crossing Feedback places the line at a fixed value and changes the line opacity based on how often the selected trace crosses it.

Use Value to set the crossing level. Use Source Trace to choose which trace is analyzed.
Max Crossings sets how many crossings are needed for the line to reach maximum opacity. Lower values make the feedback become stronger with fewer crossings.
Alpha Range sets the minimum and maximum opacity used by the feedback. The line starts near the minimum opacity when there are few or no crossings, then becomes more visible as the crossing count increases.
The readout shows the current number of crossings and the computed alpha value for the selected line.
Reference Bands
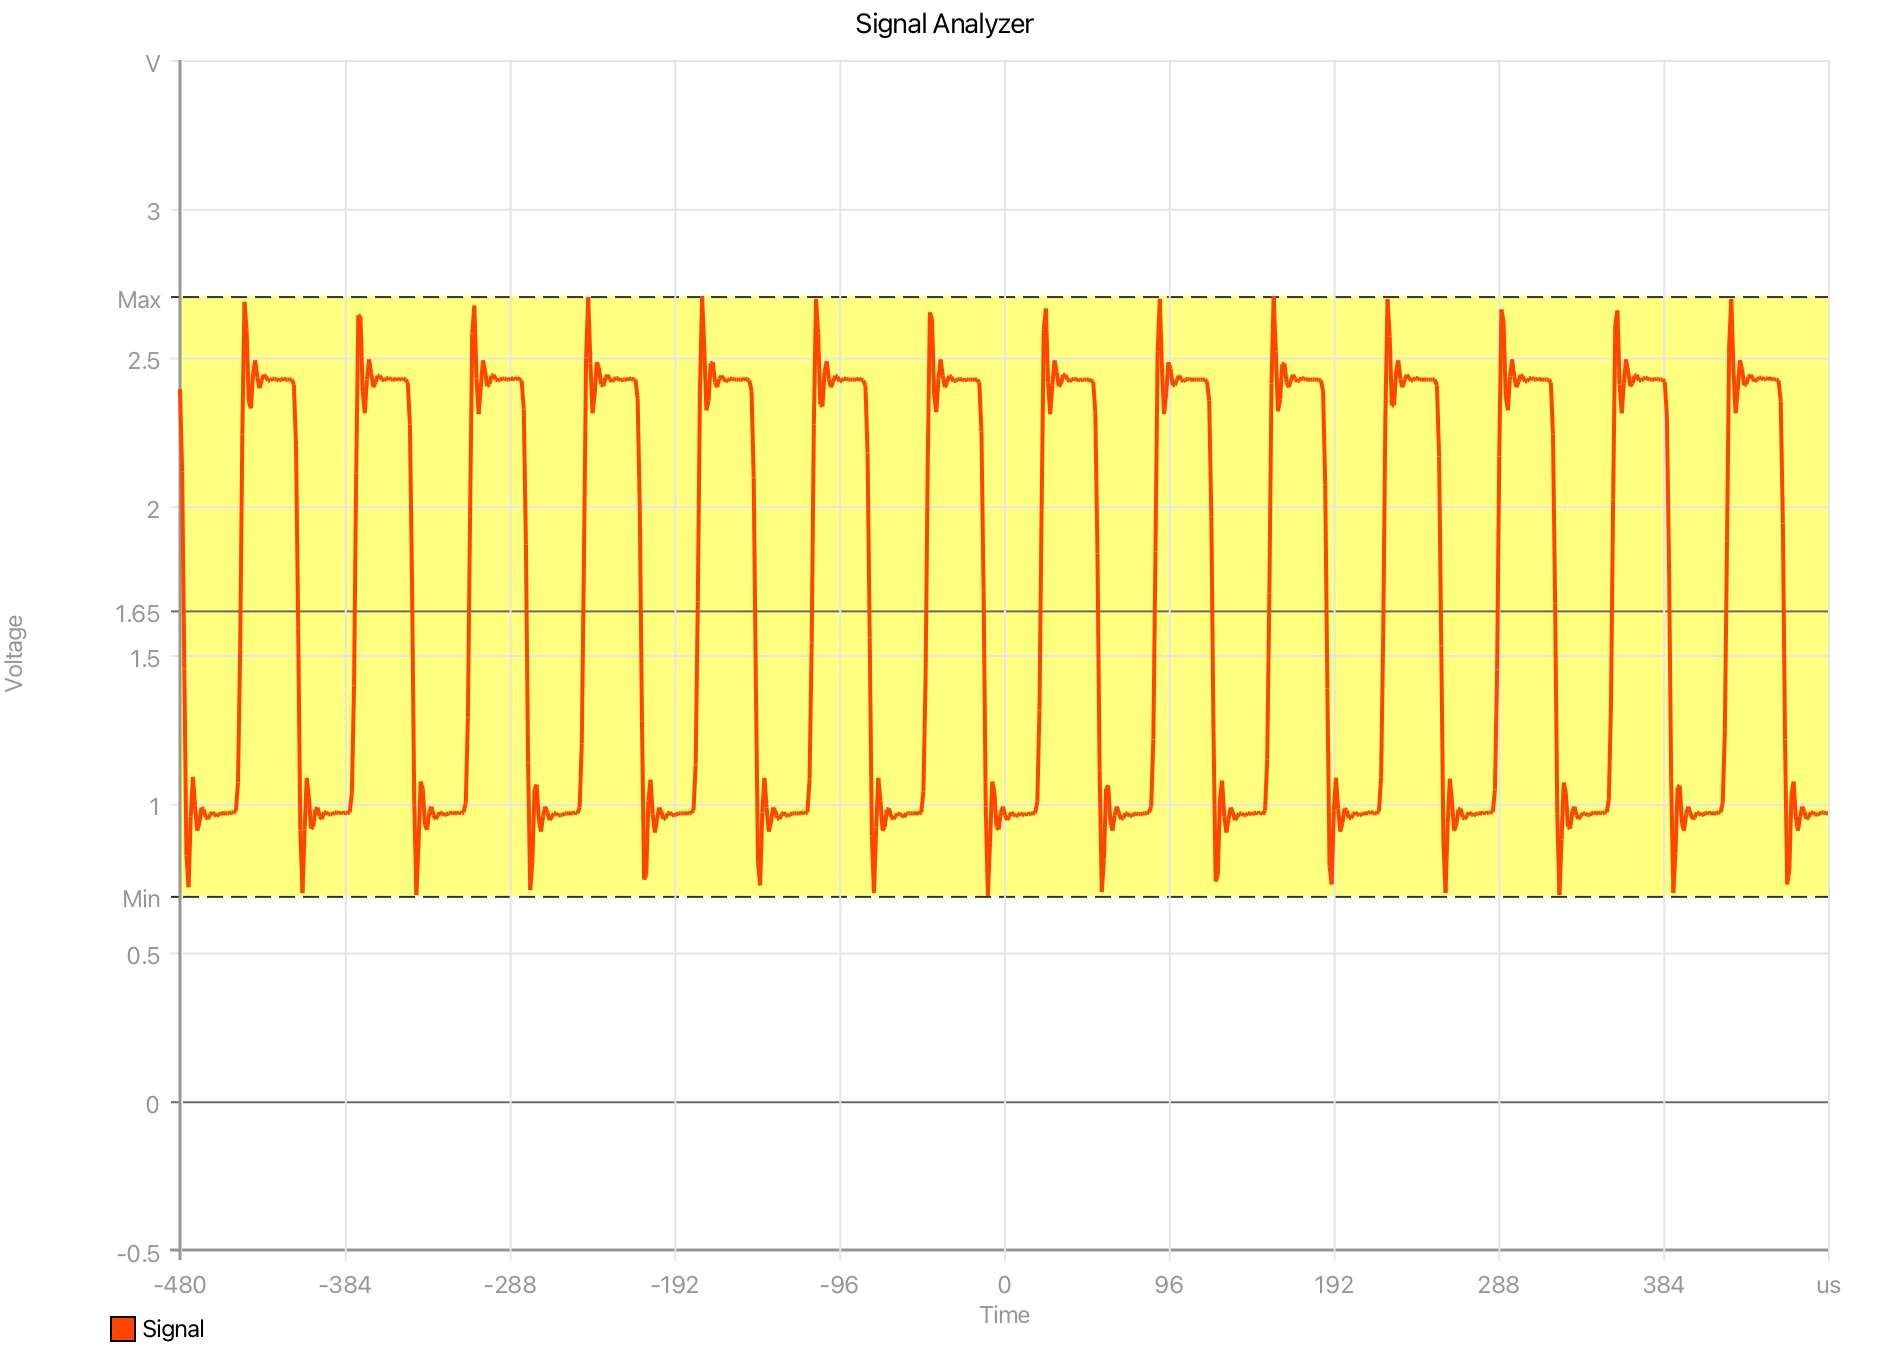
Reference bands fill the area between two reference lines. Before creating a band, add at least two reference lines on the same axis.
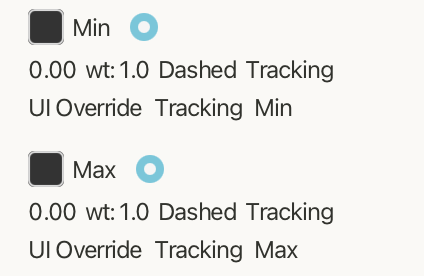
In this example, two tracking reference lines were created first: one tracking the signal minimum and one tracking the signal maximum. The reference band was then created between those two lines, filling the live range between Min and Max as the tracked values update.
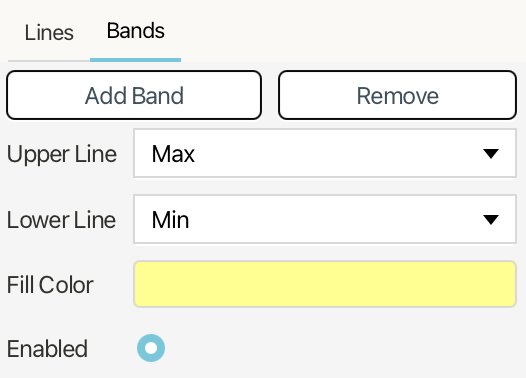
Use Add Band to create a new band from existing reference lines. Use Remove to delete the selected band.
Upper Line selects the reference line used as the upper edge of the band. Lower Line selects the reference line used as the lower edge. The selected lines define the band's boundaries.
Fill Color controls the color and transparency of the shaded region.
Enabled shows or hides the band without deleting it.
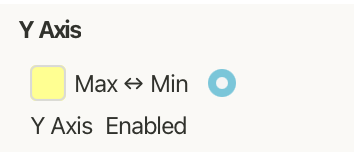
The bands list shows each band by its two boundary lines, such as Max ↔ Min, along with the axis it belongs to and whether it is enabled. Because bands are linked to reference lines, changing or tracking the underlying lines also changes the filled band.
Trace Statistics
| Statistics readout | Overlay options |
|---|---|
 |
 |
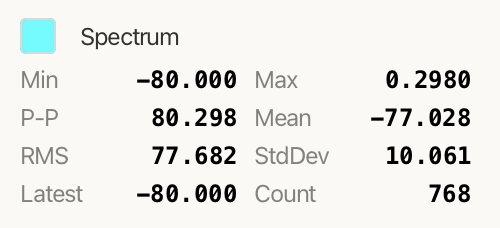
The Statistics panel calculates live statistics for selected traces. Each selected trace is shown with its trace color, name, and current values.
The available statistics are Min, Max, Peak-to-Peak, Mean, RMS, Std Dev, Latest, and Count.
Min and Max show the lowest and highest values in the current data window. Peak-to-Peak shows the difference between the maximum and minimum values. Mean shows the average value, RMS shows the root mean square value, and Std Dev shows the standard deviation. Latest shows the most recent value, and Count shows the number of samples used for the calculation.
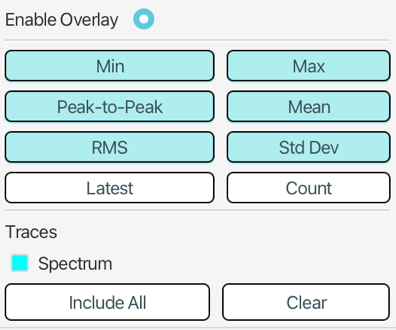
Use Enable Overlay to show or hide the statistics overlay on the selected plot.
The statistic buttons control which values are displayed. These selections apply across all statistics overlays, so enabling or disabling a value such as RMS affects every plot overlay.
The Traces section selects which traces are included for the current plot. If a plot contains multiple traces, you can include more than one trace in the overlay. Each included trace appears as its own row, using the trace color and name.
Use Include All to add every trace assigned to the current plot. Use Clear to remove all traces from the statistics overlay for that plot.
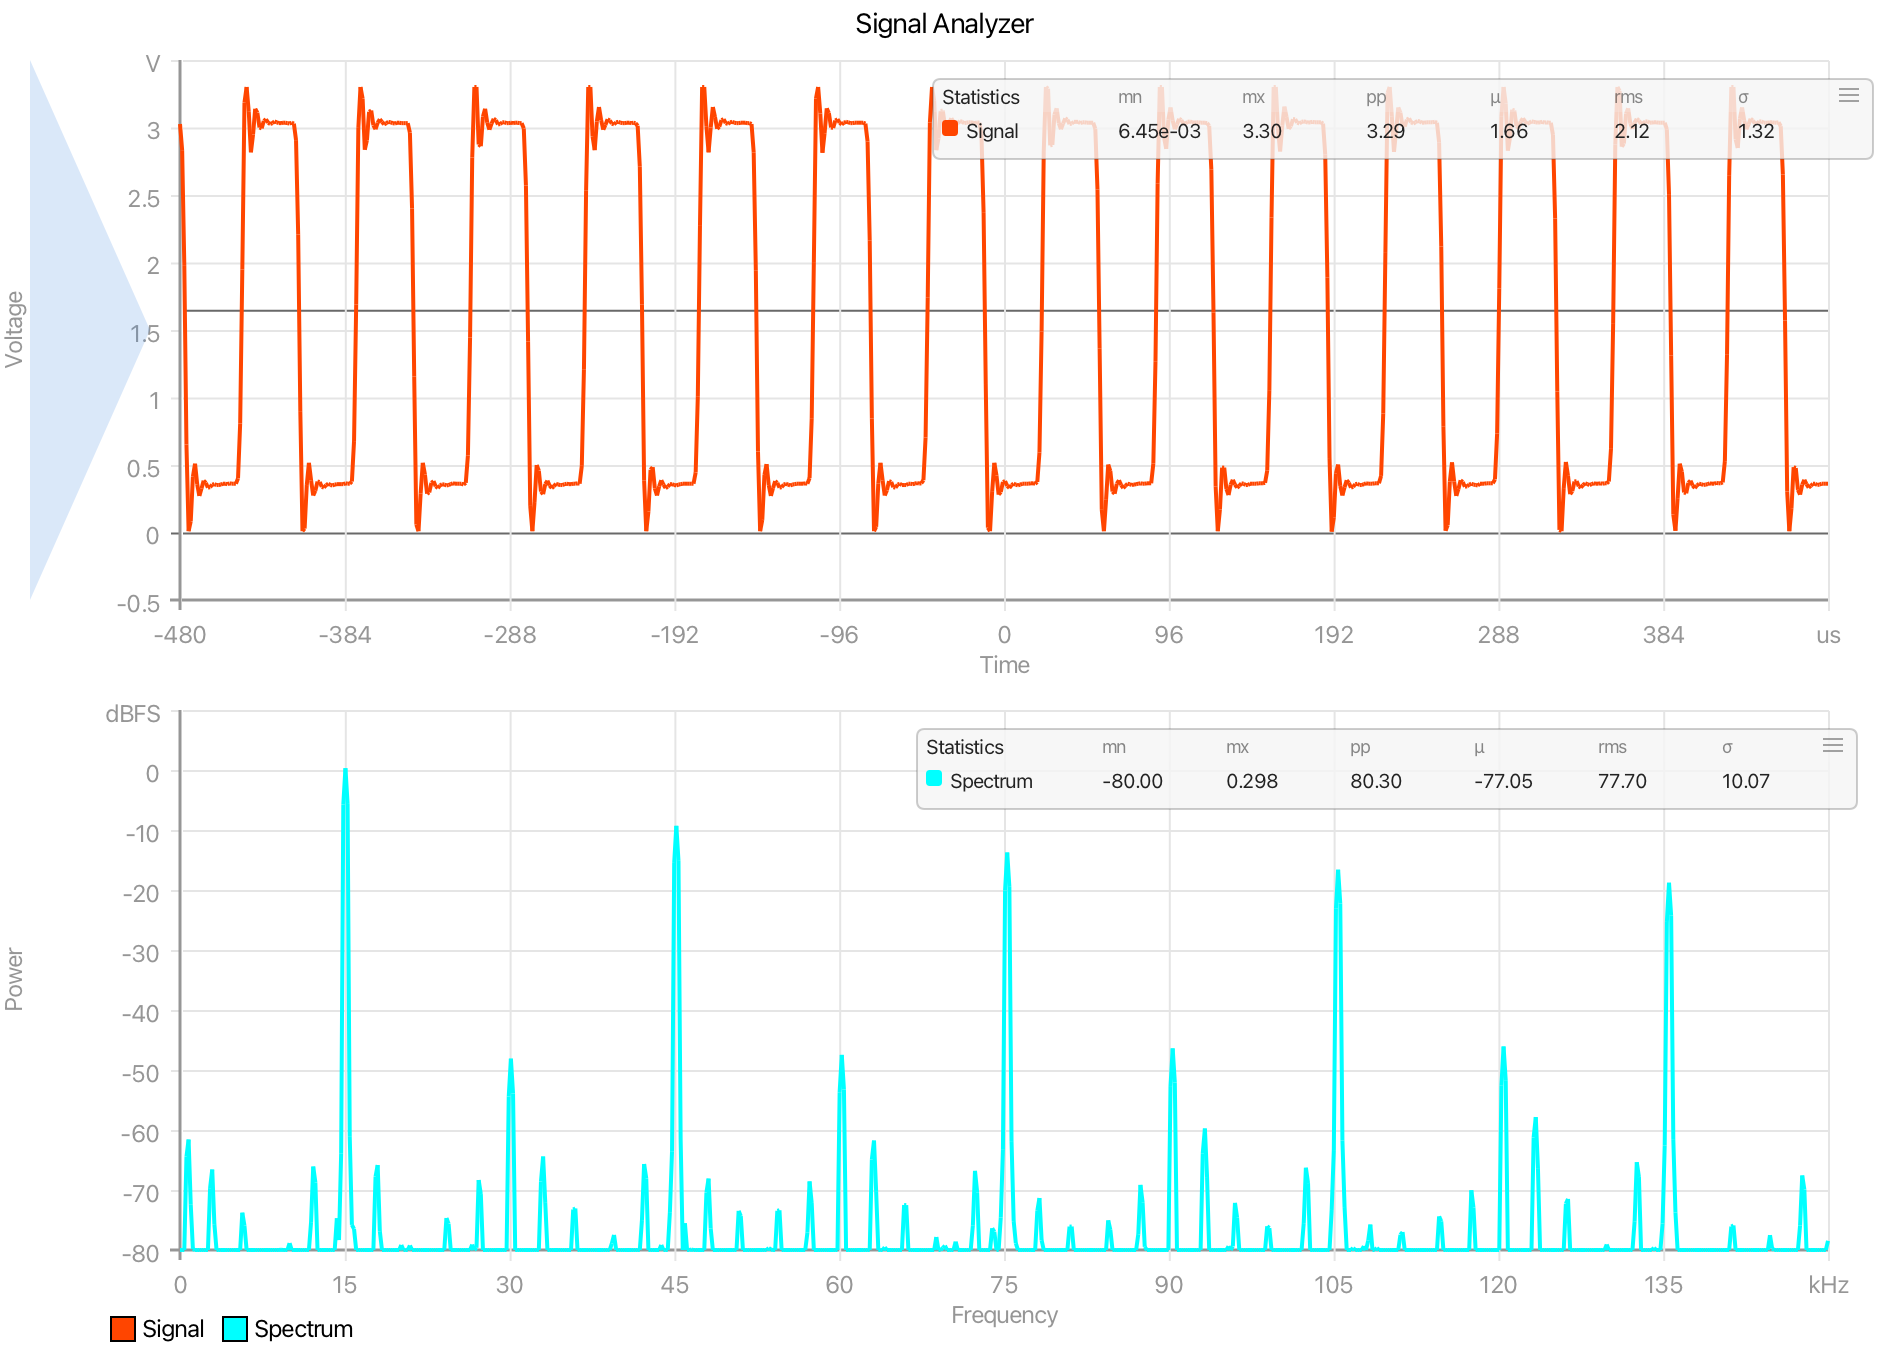
The overlay appears directly on the plot and shows the selected statistics for the included traces. Each plot can have its own overlay and its own selected traces, while the set of visible statistic columns is shared across all overlays.