Recipe 9 — Large-Dynamic-Range Sensor on a Log Axis
Some sensors produce values that span several orders of magnitude, where a linear axis hides the low end or lets the high end dominate. This recipe shows a logarithmic vertical axis with positive data, fixed decade bounds, and reference lines that remain readable across the full range. See Axis Configuration — Scale.
#include <ViewPoint.h>
using namespace viewpoint;
void setup() {
view.begin();
view.setDelay(100);
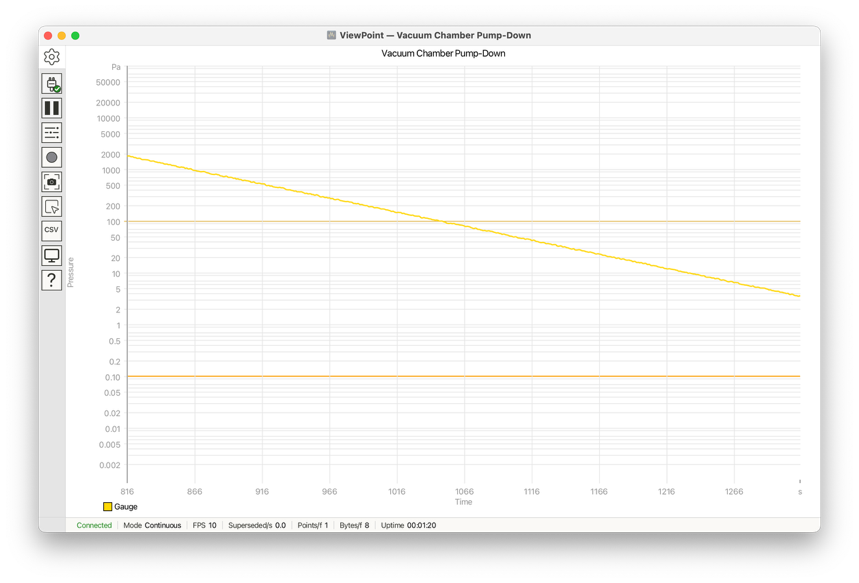
view.setTitle("Vacuum Chamber Pump-Down");
view.setPlotTitle("Chamber Pressure");
view.setVerticalRange(1e-3, 1e5);
view.enableLogarithmicScale();
view.setAxisLabels("Time", "Pressure");
view.setUnits("s", "Pa");
view.addHorizontalReferenceLine(100, colors::Goldenrod, 1.0f);
view.addHorizontalReferenceLine(0.1, colors::Orange, 1.5f);
view.trace("Gauge").setColor(colors::Gold);
}
void loop() {
// Note: full simulation available at docs.voidloop.com
view.addData("Gauge", pressure);
view.send();
}
What the functions do
enableLogarithmicScale()maps positive linear values onto a log vertical axis.setVerticalRange(1e-3, 1e5)spans eight decades; the minimum must be greater than zero.- Reference lines keep meaningful environmental levels visible across the compressed scale.
When to use this
- Use
enableLogarithmicScale(false)when the data is already in log space, such as dB. - Clamp or filter zero/negative values before plotting on a log axis.