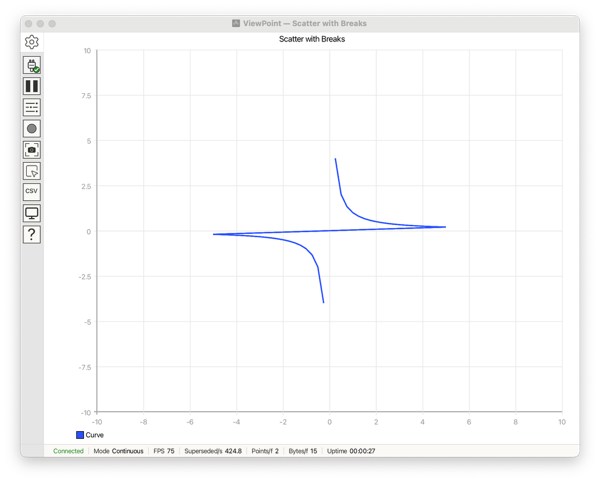
Recipe 12 — Scatter with Breaks
Scatter and Polar traces normally connect consecutive points. This recipe shows how
addBreak() inserts an intentional discontinuity so a single trace can draw
separate strokes, paths, or phasor segments without unwanted bridge lines.
addBreak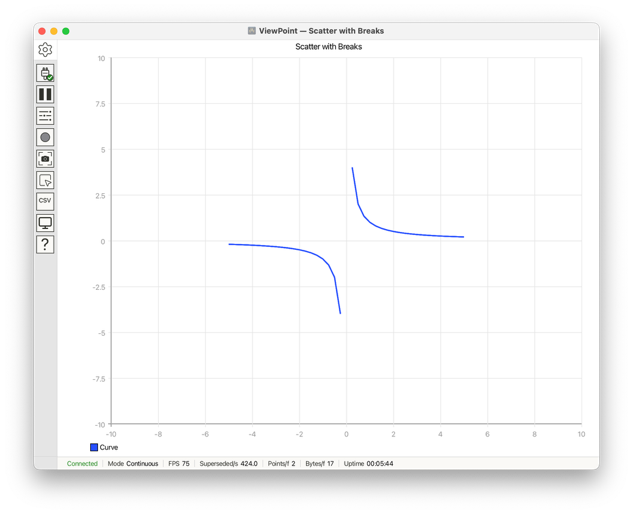
addBreakRecipe 12 — the first plot shows the sketch without addBreak; the second shows
the sketch with addBreak
#include <ViewPoint.h>

void setup() {
    view.begin(scatter, frames, 40);
    view.setTitle("Scatter with Breaks");
    view.setHorizontalRange(-10, 10);
    view.setVerticalRange(-10, 10);
}

void loop() {
    view.addBreak("Path");
    for (float x = -5.0f; x <= 5.0f; x += 0.25) {
        view.addData("Curve", 1.0f / x);
    }
    view.send();
}
What the functions do
addData("Path", x, y)appends paired points to a Scatter trace.addBreak("Curve")lifts the pen so the next point starts a new stroke, essential when one trace spans a discontinuity (an asymptote, a sensor dropout, or separate phasor segments) and you don't want the gap bridged by a connecting line.view.begin(scatter, frames, 40)selects the plot type where arbitrary paired (x, y) data is meaningful; sets the update mode to Frames; sets the number of points per frame to 40.