Recipe 5 — Custom Grid Colors and Themes
Grid colors are part of the plot's meaning, not just decoration. This recipe shows how to set label, minor-grid, and major-grid colors so a plot can match a dark lab environment, domain convention, dashboard theme, or presentation capture. See Plot Styles.
#include <ViewPoint.h>
using namespace viewpoint;
void setup() {
view.begin();
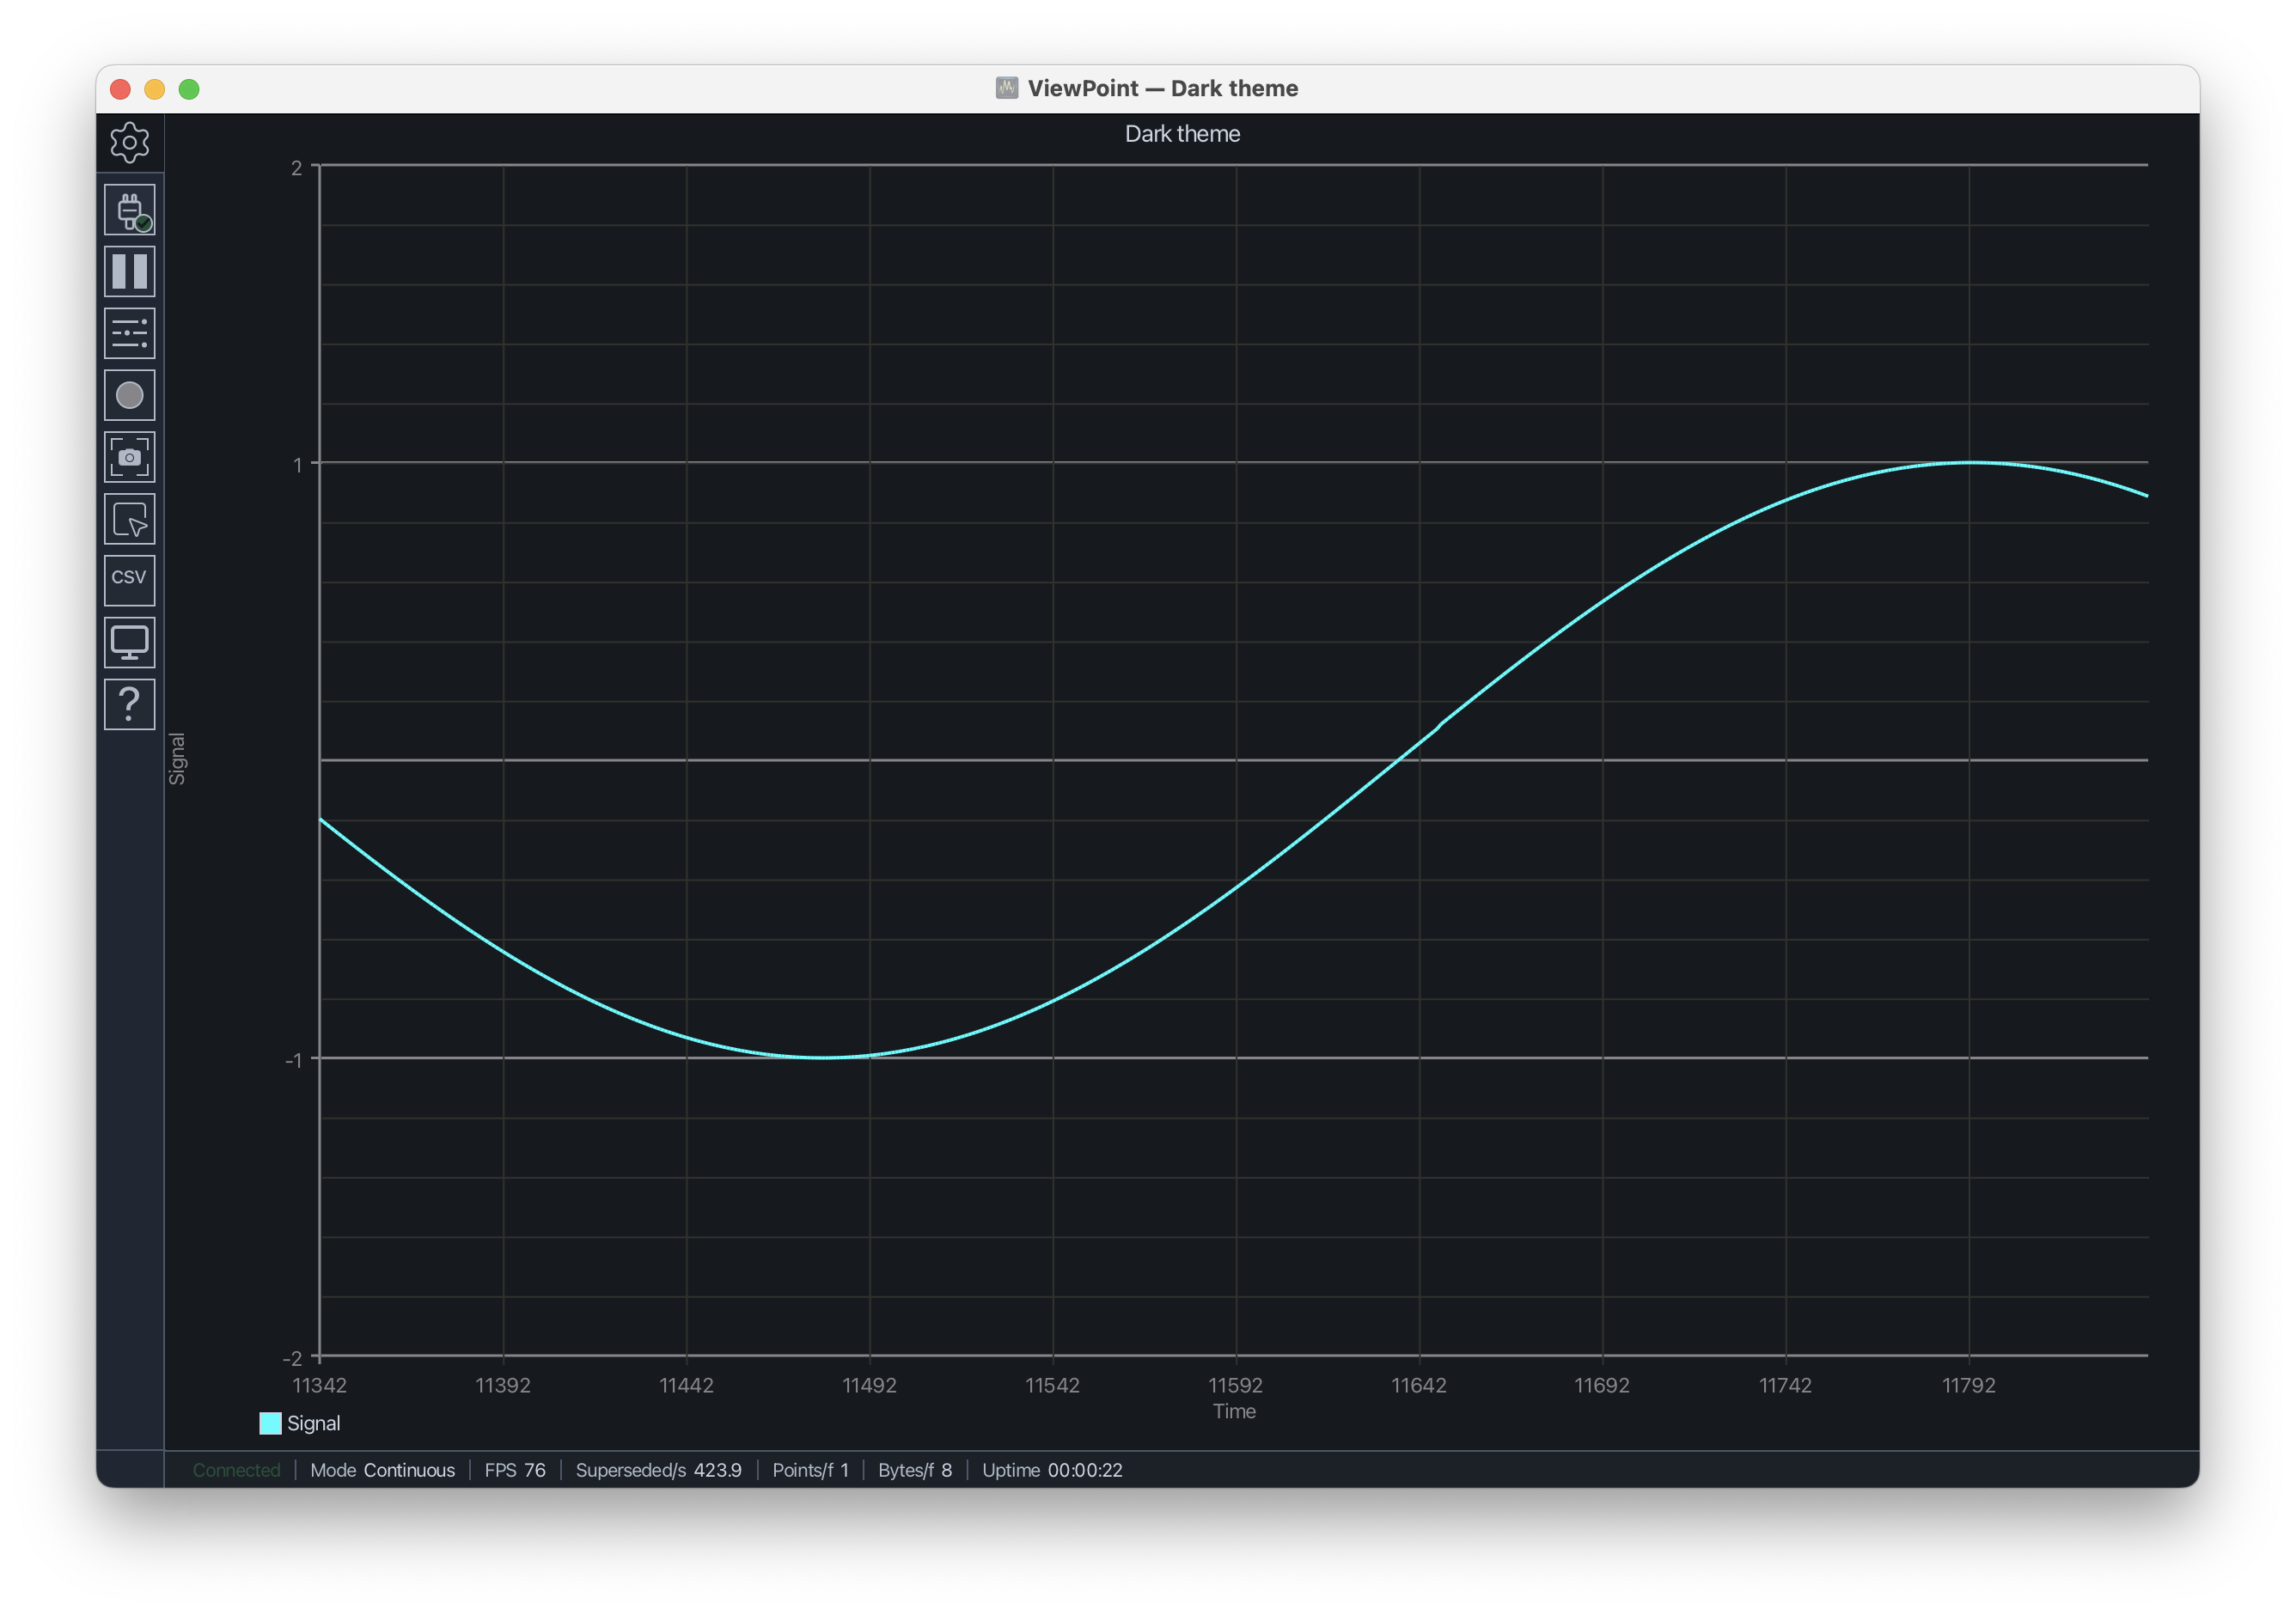
view.setTitle("Dark Theme");
view.setVerticalRange(-2.0, 2.0, 0.2, 1.0);
view.setAxisLabels("Time", "Signal");
view.setGridColors(colors::LightGray, 0x2A2A2A, 0x4A4A4A);
view.trace("Signal").setColor(colors::Cyan);
}
void loop() {
view.addData("Signal", sin(millis() / 200.0f));
view.send();
}
What the functions do
setGridColors(labels, minor, major)sets axis-label color, minor gridline color, and major gridline color.- The two-argument overload,
setGridColors(minor, major), changes gridlines without changing label color.